简体中文
繁體中文
English
Pусский
日本語
ภาษาไทย
Tiếng Việt
Bahasa Indonesia
Español
हिन्दी
Filippiiniläinen
Français
Deutsch
Português
Türkçe
한국어
العربية
Crude Oil Price Outlook Weakens, Stock Markets Sink on Trade Fears
الملخص:Crude oil has broken the recent uptrend - and an important Fibonacci retracement level - and looks likely to head lower as US-China trade talks fuel global growth fears.
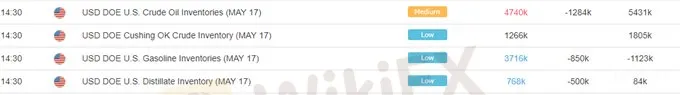
The latest US crude oil inventory data showed increased output and weaker demand, weighing on oil, with the US crude inventories rising to their highest levels in just under two years. The ongoing glut in US oil is being partially offset by ongoing OPEC production cuts which are likely to be extended into H2.
最新的美国原油库存数据显示产量增加,需求减弱,对石油造成压力,美国原油库存增加至近两年来的最高水平。美国石油持续供过于求正在部分抵消欧佩克正在进行的减产,这可能延续到下半年。
WTI vs Brent: Top 5 Differences Between WTI and Brent Crude Oil
WTI与布伦特原油:WTI与布伦特原油之间的五大差异
The technical picture for oil is suggesting marginally lower prices with support from the 38.2% Fibonacci retracement level at $70.56/bbl. broken on Wednesday. Oil has also fallen through the recent uptrend off the May 6 low around $68.76/bbl. and this low now becomes the next downside target. Below here the 200-day moving average at $67.30/bbl. comes into play. The CCI indicator has moved into oversold territory and this may stem, or slow down, current negative price sentiment.
油价技术图表显示价格略微走低,受38.2%斐波纳契回撤位70.56美元/桶的支撑。周三破了。油价也从近期的5月6日低位下跌至68.76美元/桶左右。而这个低点现在成为下一个下行目标。下方200日移动平均线为67.30美元/桶。发挥作用。 CCI指标已经进入超卖状态,这可能会阻止或减缓当前的负面价格情绪。
Crude Oil Daily Price Chart (July 2018 – May 23, 2019)
原油每日价格走势图(2018年7月 - 2019年5月23日)

عدم اعطاء رأي:
الآراء الواردة في هذه المقالة تمثل فقط الآراء الشخصية للمؤلف ولا تشكل نصيحة استثمارية لهذه المنصة. لا تضمن هذه المنصة دقة معلومات المقالة واكتمالها وتوقيتها ، كما أنها ليست مسؤولة عن أي خسارة ناتجة عن استخدام معلومات المقالة أو الاعتماد عليها.
وسيط WikiFX
أحدث الأخبار
شركة Digital Trades Group المراجعة الكاملة 2025 : موثوقة أم احتيال ؟
 WikiFX
تهنئة من WikiFX | عيدكم مبارك وكل عام وأنتم بخير
WikiFXشركة Olymp Trade المراجعة الكاملة 2025 : موثوقة أم احتيال ؟
WikiFXشركة IronFX المراجعة الكاملة 2025
WikiFXالتداول العكسي في الفوركس | ما هو وكيف يمكن استغلاله لتحقيق الربح؟
WikiFXشركة XBTFX المراجعة الكاملة 2025 : موثوقة أم احتيال ؟
WikiFXحساب النسبة

