简体中文
繁體中文
English
Pусский
日本語
ภาษาไทย
Tiếng Việt
Bahasa Indonesia
Español
हिन्दी
Filippiiniläinen
Français
Deutsch
Português
Türkçe
한국어
العربية

Franc Gains as EURCHF, USDCHF Sink. US Dollar Rising Support Held
الملخص:The Swiss Franc outperformed, EURCHF, USDCHF tumbled with US-Iran tension fears. While the Dollar extended declines, it was unable to breach rising support from September 2018.
Asia Pacific Market Open Talking Points
Anti-risk Swiss Franc outperforms, even against the Japanese Yen
US Dollar extends declines but unable to breach rising support again
S&P 500 futures pointing lower, pro-risk AUD and NZD may fall
Trade all the major global economic data live as it populates in the economic calendar and follow the live coverage for key events listed in the DailyFX Webinars. Wed love to have you along.
The anti-risk Swiss Franc outperformed against its major counterparts on Thursday despite an overall uptick in sentiment, even outperforming the similarly-behaving Japanese Yen. Franc gains picked up against the Yen heading into the European trading session as Nikkei 225 and S&P 500 futures pushed higher in the aftermath of a dovish Fed interest rate announcement, perhaps reflecting Yen-based carry demand.
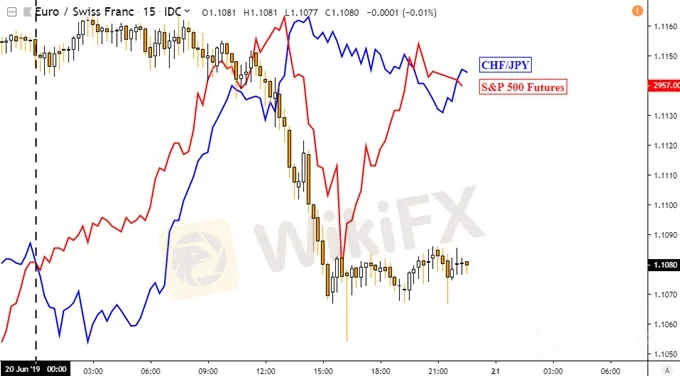
Then, EURCHF sunk and closed at its lowest since July 2017 on the 15-minute chart below. Equities cautiously retreated on US-Iran tension fears during the Wall Street trading session. US President Donald Trump tweeted that we will “soon find out” if the nation will strike Iran after it reportedly shot down a US drone. USDCHF closed at its lowest since the beginning of this year.
EURCHF 15-Minute Chart
Speaking of the US Dollar, the Greenback continued depreciating and was the worst-performing major. It tracked ongoing declines in US government bond yields as the markets confidently price in the first Fed rate cut since 2008 next month. The S&P 500 closed eight points above highs in April, making for a new record as the Dow Jones rose about one percent.
US Dollar Technical Analysis
The DXY, while succumbing to selling pressure, was unable to clear the rising trend line from September 2018 on the daily chart below. This continues to further solidify support. Meanwhile, positive RSI divergence shows fading downside momentum which can precede a turn higher. Near-term resistance appears to be around 97.52.
DXY Daily Chart

*Chart Created in TradingView
Friday Asia Pacific Session
عدم اعطاء رأي:
الآراء الواردة في هذه المقالة تمثل فقط الآراء الشخصية للمؤلف ولا تشكل نصيحة استثمارية لهذه المنصة. لا تضمن هذه المنصة دقة معلومات المقالة واكتمالها وتوقيتها ، كما أنها ليست مسؤولة عن أي خسارة ناتجة عن استخدام معلومات المقالة أو الاعتماد عليها.
وسيط WikiFX
أحدث الأخبار
تقييم شامل لشركة أوليمب تريد (Olymptrade): هل هي خيارك الأمثل لتداول الفوركس؟
 WikiFX
انضم إلى فعالية نمو الوكلاء من WikiFX | حوّل نجاحك إلى إنجاز عالمي
WikiFXتقييم شركة XLNTrade لعام 2025:يكشف جوانب خطيرة يجب أن تعرفها
WikiFXعملية احتيال فوركس دبي 2025... القصة التي أوقعت الكثيرين
WikiFXتقييم شركة Axiory: هل هي موثوقة حقًا؟
WikiFXتقييم شركة FINSAI Trade: هل منصة FINSAI Trade موثوقة أم مجرد فخ؟
WikiFXتقييم شركة FreshForex: هل هي وسيط موثوق أم لا؟
WikiFXحساب النسبة

