简体中文
繁體中文
English
Pусский
日本語
ภาษาไทย
Tiếng Việt
Bahasa Indonesia
Español
हिन्दी
Filippiiniläinen
Français
Deutsch
Português
Türkçe
한국어
العربية
Gold Prices Inch Closer to Confirming Top, US Bank Earnings Eyed
Zusammenfassung:Gold price are inching closer to confirming a large technical topping pattern and triggering trend reversal. Earnings reports from Goldman Sachs and Citigroup are due.
GOLD & CRUDE OIL TALKING POINTS:
Gold prices inch closer to confirming Head and Shoulders topping pattern
Crude oil prices break with risk trends, decline as Chevron buys Anadarko
Goldman Sachs and Citigroup earnings, EIA drilling data in focus ahead
Gold prices marked time Friday, tied down as Treasury bond yields and the US Dollar diverged again. Rates rose while the Greenback fell as JPMorgan reported first-quarter results that topped analysts forecasts, boosting risk appetite.
That sent yields higher, sapping the appeal of non-interest-bearing assets like the yellow metal. The risk-on mood translated into diminished haven demand for the global reserve currency however, making anti-fiat alternatives appear attractive by comparison.
Crude oil prices initially rallied alongside stocks after JPMorgan earnings data crossed the wires but soon changed course, retreating as markets reacted to news that Chevron Corp. has agreed to buy Anadarko Petroleum Corp. Markets seemed to see the move as likely to boost global supply.
US BANK EARNINGS IN FOCUS FOR COMMODITY MARKETS
Another round of first-quarter earnings reports from top US banks including Goldman Sachs and Citigroup is in now focus. Markets are likely to see the outcomes as global growth barometers. Upbeat results may ease slowdown fears, echoing Fridays price action, whereas disappointments may stoke risk aversion.
The EIA Drilling Productivity report is also due to cross the wires. It seems likely to show that US output continues to swell, suggesting that on-coming capacity might overwhelm OPEC-led efforts to drain global inventories. That might weigh on oil prices.
See the latest gold and crude oil forecasts to learn what will drive prices in the second quarter!
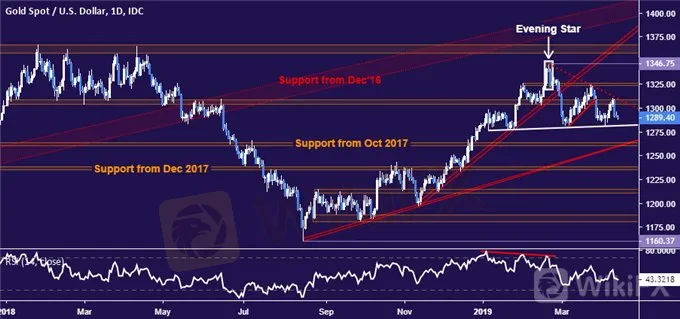
GOLD TECHNICAL ANALYSIS
Gold prices are edging toward neckline support at 1281.36. A daily close below this would confirm the formation of a bearish Head and Shoulders (H&S) pattern, hinting that major top is in place. The first layer of subsequent support is in the 1260.80-63.76 zone, but the H&S setup implies a larger decline toward the $1200/oz figure. Alternatively, break above resistance in the 1303.70-09.12 area would neutralize near-term downward pressure and put the 1323.40-26.30 region into focus.
CRUDE OIL TECHNICAL ANALYSIS
Crude oil prices continue to hover below support-turned-resistance in the 63.59-64.88 area. A break higher brings prices directly into the 66.09-67.03infection zone. Beyond that, the next upside barrier is at the $70/bbl figure. Alternatively, a turn lower that results in a close below 60.39 would break the uptrend from late December and set the stage to challenge the 57.24-88 region.

Haftungsausschluss:
Die Ansichten in diesem Artikel stellen nur die persönlichen Ansichten des Autors dar und stellen keine Anlageberatung der Plattform dar. Diese Plattform übernimmt keine Garantie für die Richtigkeit, Vollständigkeit und Aktualität der Artikelinformationen und haftet auch nicht für Verluste, die durch die Nutzung oder das Vertrauen der Artikelinformationen verursacht werden.
WikiFX-Broker
Aktuelle Nachrichten
Puma rechnete mit einer halben Milliarde Euro Gewinn – und erwartet nun rote Zahlen
 WikiFX
Im April verkaufte Jaguar Land Rover in Europa nur 49 Autos – das hat die E-Auto-Wende damit zu tun
WikiFXBNB-Preisprognose: BNB erreicht neues Allzeithoch und übertrifft die Marktkapitalisierung von Solana
WikiFXBitcoin erobert 120.000 Dollar zurück, während das Volumen an den Börsen steigt
WikiFXBitcoin, Ethereum und Ripple: Bullisches Momentum treibt die Top-3-Kryptos Richtung Allzeithochs
WikiFXRipple: Analyst warnt – stürzt XRP jetzt brutal ab?
WikiFXCoinbase und PNC kooperieren, um Kunden den Kauf von Kryptowährungen zu ermöglichen
WikiFXObwohl die Inflation bei über 30 Prozent liegt: Türkische Zentralbank senkt Leitzins
WikiFXRipple crasht - Analyst sieht +275 % Potenzial für XRP!
WikiFXEthereum-Preisprognose: ETH steigt, da die Nachfrage das Angebot übersteigt: Bitwise
WikiFXWechselkursberechnung

