简体中文
繁體中文
English
Pусский
日本語
ภาษาไทย
Tiếng Việt
Bahasa Indonesia
Español
हिन्दी
Filippiiniläinen
Français
Deutsch
Português
Türkçe
한국어
العربية
Gold Prices Coil within Two-Week Range after US NFP Letdown
Zusammenfassung:The past few days have produced choppy price action in Gold and the US Dollar, but price action after the May Fed meeting may point to near-term resolution.
Gold prices have had a rocky week, between the May Fed meeting and the April US Nonfarm Payrolls report. Fed Chair Jerome Powell came across as more optimistic than people anticipated regarding price pressures, initially sending the US Dollar higher and Gold lower on Wednesday.
Calling low inflation “transitory,” Fed Chair Powell seemingly sidestepped committing to more easing. After all, he has said that the FOMC would consider a policy adjustment if inflation were to be low on a “persistent” basis.
In turn, as the US Dollar and US Treasury yields ran higher on Wednesday and Thursday, Gold prices were knocked lower.
But that momentum was halted today when a superficially strong US jobs report didnt serve as the solidifying factor for sentiment that traders were looking for. Even though the topline figure topped 200K and the unemployment rate fell to a new cycle low, wage growth missed expectations and the labor force participation rate dropped unexpectedly.
Between the May Fed meeting and the April US Nonfarm Payrolls report, prices across asset classes have carved out a range as no clear sentiment has emerged after this week's events.
Gold Price Technical Analysis: Daily Chart (April 2018 to May 2019) (Chart 1)
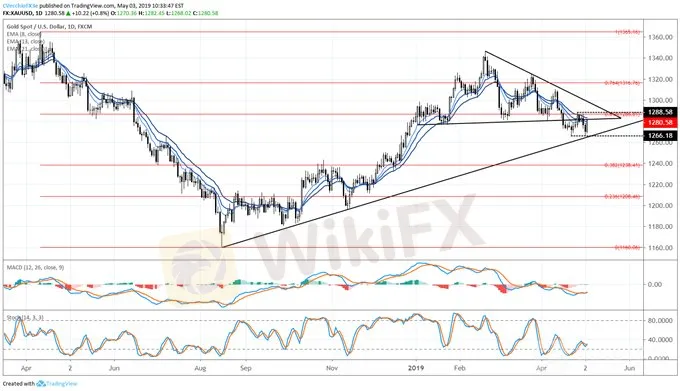
Since setting a fresh yearly low on April 16, gold prices have been moving sideways around former symmetrical triangle support. But as the uptrend from the August, October, and November 2018 lows has come into focus, gold prices have been stuck trading between 1266 and 1288. This coiling effort has shifted attention away from the multi-month symmetrical triangle to the two-week sideways consolidation.
Accordingly, the gold price forecast is necessarily neutral heading into next week: a move below 1266 by mid-May would constitute a downside break of the consolidation as well as the uptrend from the late-2018 swing lows; while a move above 1288 by mid-May would constitute a topside break of the consolidation as well as the downtrend from the February and March 2019 highs.
IG Client Sentiment Index: Spot Gold Price Forecast (May 3, 2019) (Chart 2)

Spot gold: Retail trader data shows 75.9% of traders are net-long with the ratio of traders long to short at 3.15 to 1. The number of traders net-long is 0.2% lower than yesterday and 3.3% lower from last week, while the number of traders net-short is 7.2% lower than yesterday and 4.1% lower from last week.
We typically take a contrarian view to crowd sentiment, and the fact traders are net-long suggests spot gold prices may continue to fall. Traders are further net-long than yesterday and last week, and the combination of current sentiment and recent changes gives us a stronger spot gold-bearish contrarian trading bias.
Haftungsausschluss:
Die Ansichten in diesem Artikel stellen nur die persönlichen Ansichten des Autors dar und stellen keine Anlageberatung der Plattform dar. Diese Plattform übernimmt keine Garantie für die Richtigkeit, Vollständigkeit und Aktualität der Artikelinformationen und haftet auch nicht für Verluste, die durch die Nutzung oder das Vertrauen der Artikelinformationen verursacht werden.
WikiFX-Broker
Aktuelle Nachrichten
Puma rechnete mit einer halben Milliarde Euro Gewinn – und erwartet nun rote Zahlen
 WikiFX
Coinbase und PNC kooperieren, um Kunden den Kauf von Kryptowährungen zu ermöglichen
WikiFXObwohl die Inflation bei über 30 Prozent liegt: Türkische Zentralbank senkt Leitzins
WikiFXRipple crasht - Analyst sieht +275 % Potenzial für XRP!
WikiFXReaktion auf geschwächte Wirtschaft: Russische Zentralbank senkt Leitzins
WikiFXRipple (XRP): Abwärtstrend setzt sich fort, Bären übernehmen die Kontrolle
WikiFXBNB-Kurs fällt leicht zurück nach Allzeithoch – Markt bleibt gespannt
WikiFXDeutsche Bank erzielt höchsten Gewinn seit Finanzkrise 2007 – Kosten sollen weiter sinken
WikiFXVW kriselt immer stärker: Grund ist das schwache Luxus-Geschäft
WikiFXSolana (SOL): Preis fällt weiter und rutscht unter 180 $
WikiFXWechselkursberechnung

