简体中文
繁體中文
English
Pусский
日本語
ภาษาไทย
Tiếng Việt
Bahasa Indonesia
Español
हिन्दी
Filippiiniläinen
Français
Deutsch
Português
Türkçe
한국어
العربية
USDCAD: USD Eyes Powell & Fed, CAD Climbs on USMCA & Oil
Zusammenfassung:The Canadian Dollar climbs on the back of recent USMCA tailwinds and oil price gains, but the prospect of hawkish FOMC minutes due Wednesday threatens to keep USD bid.
USDCAD – TALKING POINTS
USDCAD slid toward the 1.3400 handle as positive developments around USMCA and oil prices benefit the Canadian Dollar
Fed meeting minutes on deck for release Wednesday risks a possible reversal higher in spot prices
{3}
Find out How to Tell When a Currency Pair is Changing its Trend
{3}
USDCAD dipped to the 1.3400 handle as upbeat USMCA news continues to put downward pressure on the currency pair. The recent move lower in USDCAD was likely exacerbated by gains in oil following reports that OPEC production cuts will be extended while recent Iranian conflict could further threaten global oil supply.
USDCAD PRICE CHART: 30-MINUTE TIME FRAME (MAY 17, 2019 TO MAY 21, 2019)
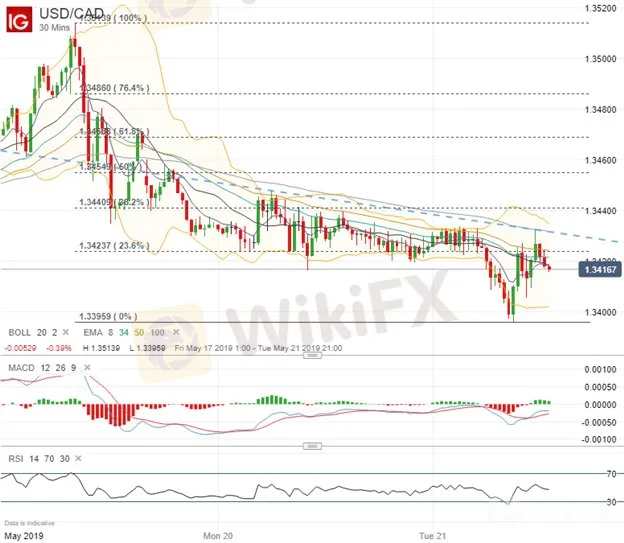
Although the Canadian Dollar looks to continue benefiting from an impending trade deal with the United States in addition to climbing oil prices, further downside in spot USDCAD could be limited over the short-term. One notable technical development during Tuesdays session was the sharp rebound higher USDCAD notched after touching the 1.3400 price level – a major area of confluence which looks to serve as technical support.
If spot USDCAD continues to creep higher and breaks above the negative-sloping trendline drawn along the series of lower highs since last Friday, it might signal that the latest push lower in USDCAD may be running out of steam. This possible scenario could grow increasingly likely if the forex rate also overcomes technical resistance posed by the 23.6 percent and 38.2 percent Fibonacci retracement levels shown above.
USDCAD PRICE CHART: WEEKLY TIME FRAME (SEPTEMBER 16, 2018 TO MAY 21, 2019)

Looking at USDCAD with a broader perspective, spot prices also face resistance from the 23.6 percent Fibonacci retracement level drawn from the respective low and high in October and December last year. Yet the currency pair has failed to hold its footing below the 38.2 percent Fib since spot prices reclaimed the 1.3330 level back in March.
Moreover, a tight coil has formed between bullish uptrend and bearish downtrend lines which supplements the recent consolidation in USDCAD around the 1.3400 handle. This area of confluence could be put to the test in the near future, however, as conflicting upside and downside risks begin to unfold.
While the removal of US tariffs on Canadian steel exports boosts bullish prospects for the loonie along with rising oil prices, USDCAD downside could be offset by a sharp rise in the greenback if a hawkish Fed is revealed in the FOMC minutes release due Wednesday at 18:00 GMT.
- Written by Rich Dvorak, Junior Analyst for DailyFX
- Follow @RichDvorakFX on Twitter
Haftungsausschluss:
Die Ansichten in diesem Artikel stellen nur die persönlichen Ansichten des Autors dar und stellen keine Anlageberatung der Plattform dar. Diese Plattform übernimmt keine Garantie für die Richtigkeit, Vollständigkeit und Aktualität der Artikelinformationen und haftet auch nicht für Verluste, die durch die Nutzung oder das Vertrauen der Artikelinformationen verursacht werden.
WikiFX-Broker
Aktuelle Nachrichten
Coinbase und PNC kooperieren, um Kunden den Kauf von Kryptowährungen zu ermöglichen
 WikiFX
Obwohl die Inflation bei über 30 Prozent liegt: Türkische Zentralbank senkt Leitzins
WikiFXRipple crasht - Analyst sieht +275 % Potenzial für XRP!
WikiFXPuma rechnete mit einer halben Milliarde Euro Gewinn – und erwartet nun rote Zahlen
WikiFXReaktion auf geschwächte Wirtschaft: Russische Zentralbank senkt Leitzins
WikiFXRipple (XRP): Abwärtstrend setzt sich fort, Bären übernehmen die Kontrolle
WikiFXBNB-Kurs fällt leicht zurück nach Allzeithoch – Markt bleibt gespannt
WikiFXDeutsche Bank erzielt höchsten Gewinn seit Finanzkrise 2007 – Kosten sollen weiter sinken
WikiFXVW kriselt immer stärker: Grund ist das schwache Luxus-Geschäft
WikiFXSolana (SOL): Preis fällt weiter und rutscht unter 180 $
WikiFXWechselkursberechnung

