简体中文
繁體中文
English
Pусский
日本語
ภาษาไทย
Tiếng Việt
Bahasa Indonesia
Español
हिन्दी
Filippiiniläinen
Français
Deutsch
Português
Türkçe
한국어
العربية
Sterling Price Outlook: Pound at Key Support as Brexit Saga Continues
Abstract:Sterling is trading within the confines of a near-term consolidation pattern just above key support. Here are the levels that matter on the GBP/USD charts this week.
GBP/USD in consolidation within the March range – breakout potential
Check out our 2019 projections in our Free DailyFX GBP/USD Trading Forecasts
Join Michael for Live Weekly Strategy Webinars on Mondays at 12:30GMT
The British Pound is down more than 2.5% from the yearly highs against the US Dollar with Sterling trading within the confines of a near-term consolidation pattern just above support. These are the updated targets and invalidation levels that matter on the GBP/USD charts as the Brexit saga continues. Review this weeks Strategy Webinar for an in-depth breakdown of this setup and more.
New to Forex Trading? Get started with this Free Beginners Guide
{7}
GBP/USD Daily Price Chart
{7}
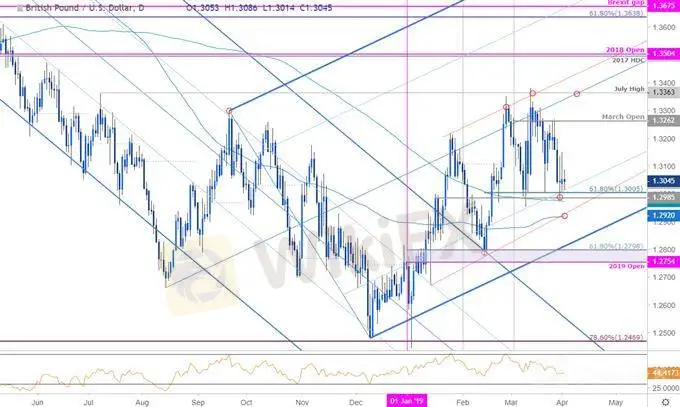
Technical Outlook: In my latest GBP/USD Weekly Technical Outlook we noted that the, “risk remains weighted to the downside heading into the close of the month / quarter but ultimately the broader outlook remains constructive while above yearly open support at 1.2754.” The threat remains for a deeper pullback within the confines of the uptrend with Sterling respecting the March opening-range into the start of 2Q – were looking for the break.
Daily support rests at 1.2975-1.3004 – a region defined by the 200-day moving average & the 61.8% retracement of the February advance. A break / close below this threshold would threaten a larger set-back towards the lower parallels. Initial resistance stands at the March open at 1.3262 backed by the median-line / July high at 1.3363 – a breach / close above would be needed to mark resumption.
Learn how to Trade with Confidence in our Free Trading Guide
GBP/USD 240min Price Chart

Notes: A closer look at price action shows Sterling trading within the confines of a consolidation formation just above confluence support at 1.2985-1.3004. A break below this threshold exposes subsequent support objectives at the 100-day moving average at ~1.2920 and the 100% extension at 1.2891- both levels of interest for possible exhaustion / long-entries IF reached. Initial resistance stands at 1.3157 with a breach above 1.3226 needed to shift the near-term focus back to the long-side targeting 1.3363.
Even the most seasoned traders need a reminder every now and then-Avoid these Mistakes in your trading
Bottom line: We‘re looking for a break of this near-term consolidation in price with the broader risk weighted to the downside while below 1.3226 for now. From a trading standpoint, we’ll favor fading strength while within this channel formation – ultimately, a larger set-back may offer more favorable entries lower down near broader uptrend support. Keep in mind were in the first few days of the month / quarter with US Non-Farm Payrolls (NFP) on tap this Friday- tread lightly.
For a complete breakdown of Michaels trading strategy, review his Foundations of Technical Analysis series on Building a Trading Strategy
GBP/USD Trader Sentiment

A summary of IG Client Sentiment shows traders are net-long GBP/USD- the ratio stands at +1.88 (65.3% of traders are long) – bearish reading
Traders have remained net-long since March 26th; price has moved 1.2% lower since then
Long positions are3.4% lower than yesterday and 33.1% higher from last week
Short positions are 2.7% higher than yesterday and 19.2% lower from last week
We typically take a contrarian view to crowd sentiment, and the fact traders are net-long suggests GBP/USD prices may continue to fall. Yet, traders are less net-long than yesterday but more net-long from last week and the combination of current positioning& recent changes gives us a further mixed GBP/USD trading bias from a sentiment standpoint.
{22}
See how shifts in GBP/USD retail positioning are impacting trend- Learn more about sentiment!
{22}
---
Relevant UK / US Economic Data Releases

Economic Calendar - latest economic developments and upcoming event risk. Learn more about how we Trade the News in our Free Guide!.
Active Trade Setups
Canadian Dollar Price Outlook: USD/CAD- Break or Bend, Monthly Highs
Oil Price Outlook: Crude Breakout Battles 60- WTI Trade Levels
Kiwi Price Outlook: NZD/USD Post-RBNZ Sell-Off Targets Yearly Support
{30}
Gold Price Outlook: XAU/USD Rally Folds from Fibonacci Resistance
{30}
Euro Price Outlook: EUR/USD Battle Lines Drawn into March Close
- Written by Michael Boutros, Currency Strategist with DailyFX
Follow Michael on Twitter @MBForex
Disclaimer:
The views in this article only represent the author's personal views, and do not constitute investment advice on this platform. This platform does not guarantee the accuracy, completeness and timeliness of the information in the article, and will not be liable for any loss caused by the use of or reliance on the information in the article.
Read more

Upbeat U.S. GDP Spurs Dollar Strength
The U.S. GDP released yesterday surpassed market expectations, which has tempered some speculation about a Fed rate cut and spurs dollar's strength.

Oil Price Soar on Geopolitical Tension
Geopolitical tensions in both the Middle East and Eastern Europe have escalated, oil prices surged nearly 3% in yesterday's session. creating significant unease in the broader financial markets.

KVB Market Analysis | 23 August: JPY Gains Ground Against USD as BoJ Signals Possible Rate Hike
JPY strengthened against the USD, pushing USD/JPY near 145.00, driven by strong inflation data and BoJ rate hike expectations. Japan's strong Q2 GDP growth added support. However, USD gains may be limited by expectations of a Fed rate cut in September.

BoJ Holds Firm on Tightening Path Fuels Yen
The Bank of Japan (BoJ) remains on course with its monetary tightening policy, according to the BoJ Chief, following his hearing at the Japan Lower House.
WikiFX Broker
Latest News
Olymptrade Under Fire – Fraud Allegations and Investor Outrage
 WikiFX
Hantec Markets Appoints New Executives for Growth in Dubai
WikiFXIs the Forex Bonus a Genuine Perk or Just a Gimmick?
WikiFXOctaFX Was Fined $37,000 for Operating Without a License
WikiFXWhat Role do signals play in the forex trading?
WikiFX5 Reasons Why Traders Are Losing Trust in Headway Broker
WikiFXWhat WikiFX Found When It Looked Into Vestrado
WikiFXHantec Financial: A Closer Look at Its Licenses
WikiFXeToro Joins Hands with Premiership Women’s Rugby
WikiFXRM750 Million Lost to Investment Scams in Just Six Months
WikiFXCurrency Calculator

