简体中文
繁體中文
English
Pусский
日本語
ภาษาไทย
Tiếng Việt
Bahasa Indonesia
Español
हिन्दी
Filippiiniläinen
Français
Deutsch
Português
Türkçe
한국어
العربية
Trading Triangles in Price Action
Abstract:Much of trading is waiting. I get it, that’s not what you want to hear. You want action, you want riveting, you want excitement. Heck, this topic is called price ‘action’ so, there surely must be something actionable about it, right?

Well, the problem is, if you‘re not prepared for volatility when it shows up, there’s a very strong chance that you‘ll end up chasing your tail once it does. Most traders do, at least, and this is why many retail traders end up buying highs or selling lows – they get caught up in the excitement of a fast market and they don’t want to miss out (FOMO) but, on the same token they dont quite know what to do.
This is where digestion can be helpful, and I‘m not talking about eating a balanced breakfast. I’m referring to trading setups and the fact that markets, like most humans, operate in cycles. There will often be a burst of activity followed by a pattern of digestion as the market incorporates these new higher/lower prices. It‘s only rationale that traders that were long ahead of a strong spike will look to take profits. And the simple act of some traders taking profits can lead others to do the same, fearful of surrendering gains. And we’ll likely even get the contrarians in the mix, as they look to establish fresh shorts from new highs – all which can relate to a strong price move lower as supply exceeds demand at this new, higher price.
This is simply digestion, and it takes place on all time frames in multitude of ways. But, the devil is in the details, as they say, and digestion can often take the form of a price action pattern that traders can then use to generate trading setups.
THE TRIANGLE
The triangle pattern is one horizontal level and one trend line. Thats it. We have a full article on the ascending triangle, highlighting how a horizontal resistance level can be matched with higher-lows as produced by a bullish trendline to create the formation. The descending triangle, on the other hand, will have a horizontal level of support coupled with a bearish trendline showing lower-highs.
The key here is diminishing marginal impact. And let‘s tell the story from the perspective of a massive level of support, let’s look at an example in USD/JPY.
In early January 2022, USD/JPY set a swing high at 116.35. The pair had pulled back by a little under 300 pips but, a few months later, buyers were again rebuked at that same price. And, again, another pullback ensued – but this time – sellers couldnt drive as far as they could the first.
This is an illustration of that resistance at 116.35 carrying less impact on the second test as buyers had already pushed into that zone. This created an ascending triangle, with horizontal resistance coupled with higher-lows, which you can see on the right side of the below chart.
USD/JPY Daily Price Chart
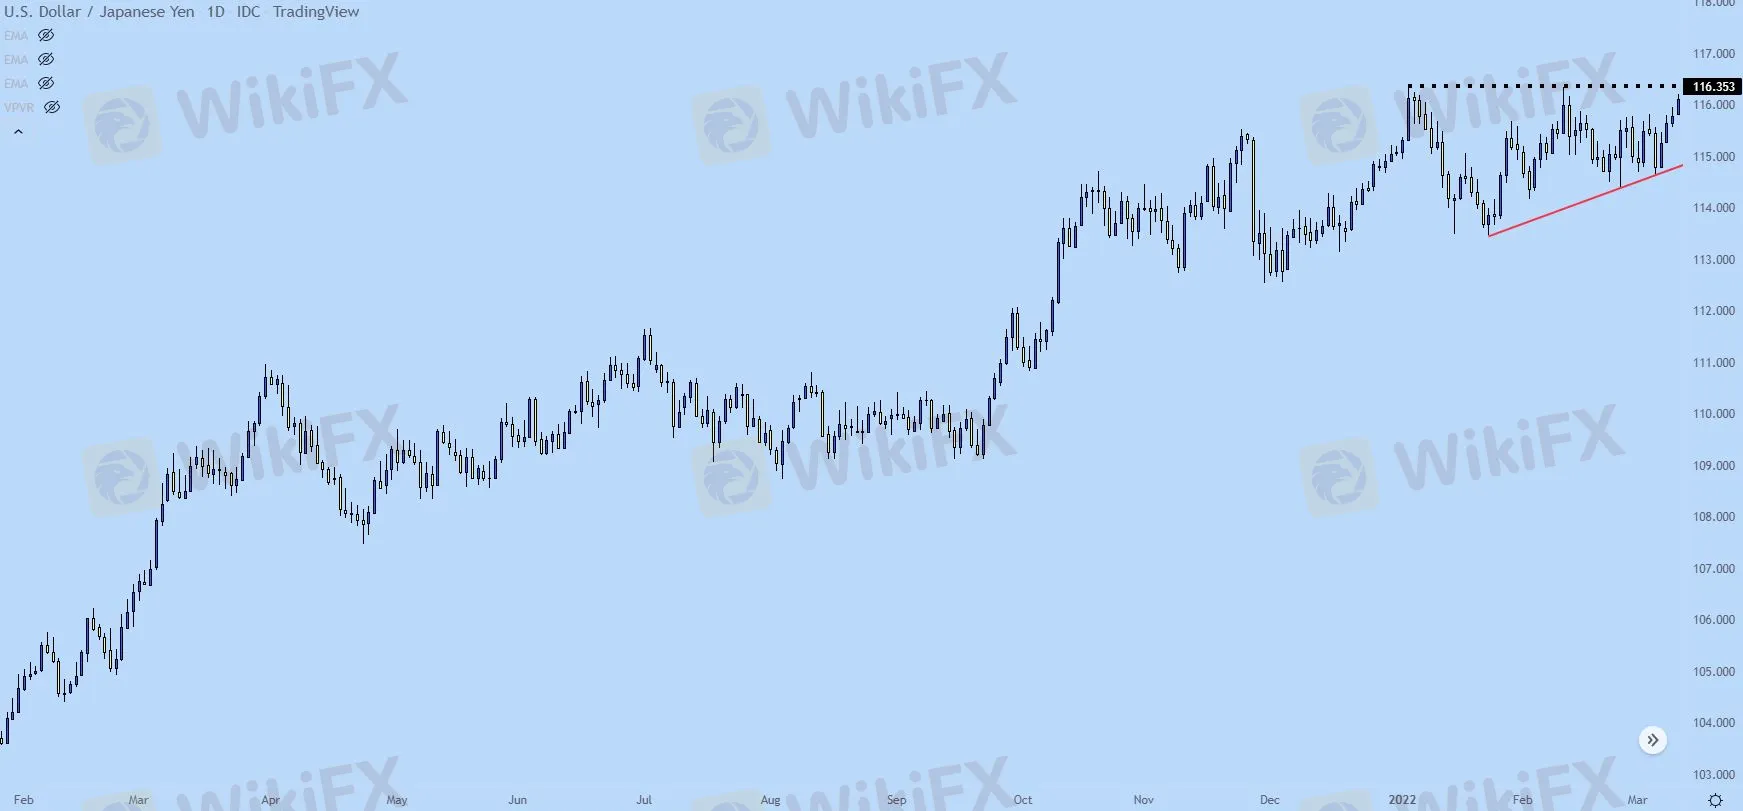
USD/JPY Daily Price Chart

DIFFERENCE FROM THE WEDGE
The main difference between the triangle and the wedge is the horizontal support or resistance. In triangle formations, this is a level thats expected to be broken with enough persistence from buyers (for resistance) or sellers (for support).
The falling wedge, on the other hand, is showing that sellers are really aggressive near resistance or at highs while being passive around lows or support. This can often build in due to a major support or resistance level, as sellers look to avoid selling near that key support. But, that itself is deductive, as that passive nature near lows or at support can often lead-in to a reversal scenario, as we look at in our article on the topic of wedges.

Disclaimer:
The views in this article only represent the author's personal views, and do not constitute investment advice on this platform. This platform does not guarantee the accuracy, completeness and timeliness of the information in the article, and will not be liable for any loss caused by the use of or reliance on the information in the article.
Read more
How to Use Retracement in Trading
Understanding retracement is essential for strategic trading. In today’s article, we will focus on the retracement is a temporary, short-lived pullback in the price of a financial instrument, like a stock or an index, that occurs within a larger, established trend. Think of it as a brief pause or a correction before the market continues its original movement. Unlike a trend reversal, which signals a fundamental shift in direction, a retracement represents a temporary deviation that doesn't jeopardize the long-term trend.
What Is Indices in Forex? A Beginner’s Guide to Trading Forex Indices
Understand what indices in forex are, how DXY works, key differences vs pairs, pros/cons, and where to trade CFDs—beginner-friendly, expert-backed guide.

Malaysian Finfluencers Could Face RM10 Million Fine or 10 Years in Prison!
A new regulatory measure by the Securities Commission Malaysia (SC) is set to change the country’s online trading and financial influencer landscape. Starting 1 November 2025, any trader or influencer caught promoting an unlicensed broker could face a fine of up to RM10 million, a prison sentence of up to 10 years, or both.

Juno Markets: A Closer Look at Its Licenses
When selecting a broker, understanding its regulatory standing is an important part of assessing overall reliability. For traders seeking to protect their capital, ensuring that a platform operates under recognised and stringent oversight can make all the difference. Keep reading to learn more about Juno Markets and its licenses.
WikiFX Broker
Latest News
What Is Indices in Forex? A Beginner’s Guide to Trading Forex Indices
 WikiFX
FBI Issues Urgent Warning on Crypto Recovery Scams
WikiFXRobinhood Moves Toward MENA Expansion with Dubai DFSA License Application
WikiFXHow to Use Retracement in Trading
WikiFXCySEC warns the public against 17 investment websites
WikiFXGermany's Industrial Core Is Collapsing Under The US Trade Deal And The Green Agenda
WikiFXUnderstanding Forex Spread Cost and How to Minimize It
WikiFXJuno Markets: A Closer Look at Its Licenses
WikiFXComplaints Against Weltrade | Traders Can’t Get Their Money Back
WikiFXFake Trader Faces 20 Years & RM9 Million Fine for RM1.45 Mil Derivatives Scam
WikiFXCurrency Calculator

