简体中文
繁體中文
English
Pусский
日本語
ภาษาไทย
Tiếng Việt
Bahasa Indonesia
Español
हिन्दी
Filippiiniläinen
Français
Deutsch
Português
Türkçe
한국어
العربية
Price Action: The Power of the Wick

Abstract:Probably one of the more compelling areas of price action is in its ability to show key levels or price zones that matter. And to be sure, there’s a lot of ways of finding potential support and resistance levels but none of those prices are worth very much if they don’t actually show as support or resistance.

For the purpose of identifying support and resistance, candlestick wicks can be incredibly powerful and this also speaks to multiple time frame analysis.
If youre following prices on an hourly chart and price suddenly reverses from a bullish trend, erasing the entirety of the move – how would that show on a daily chart?
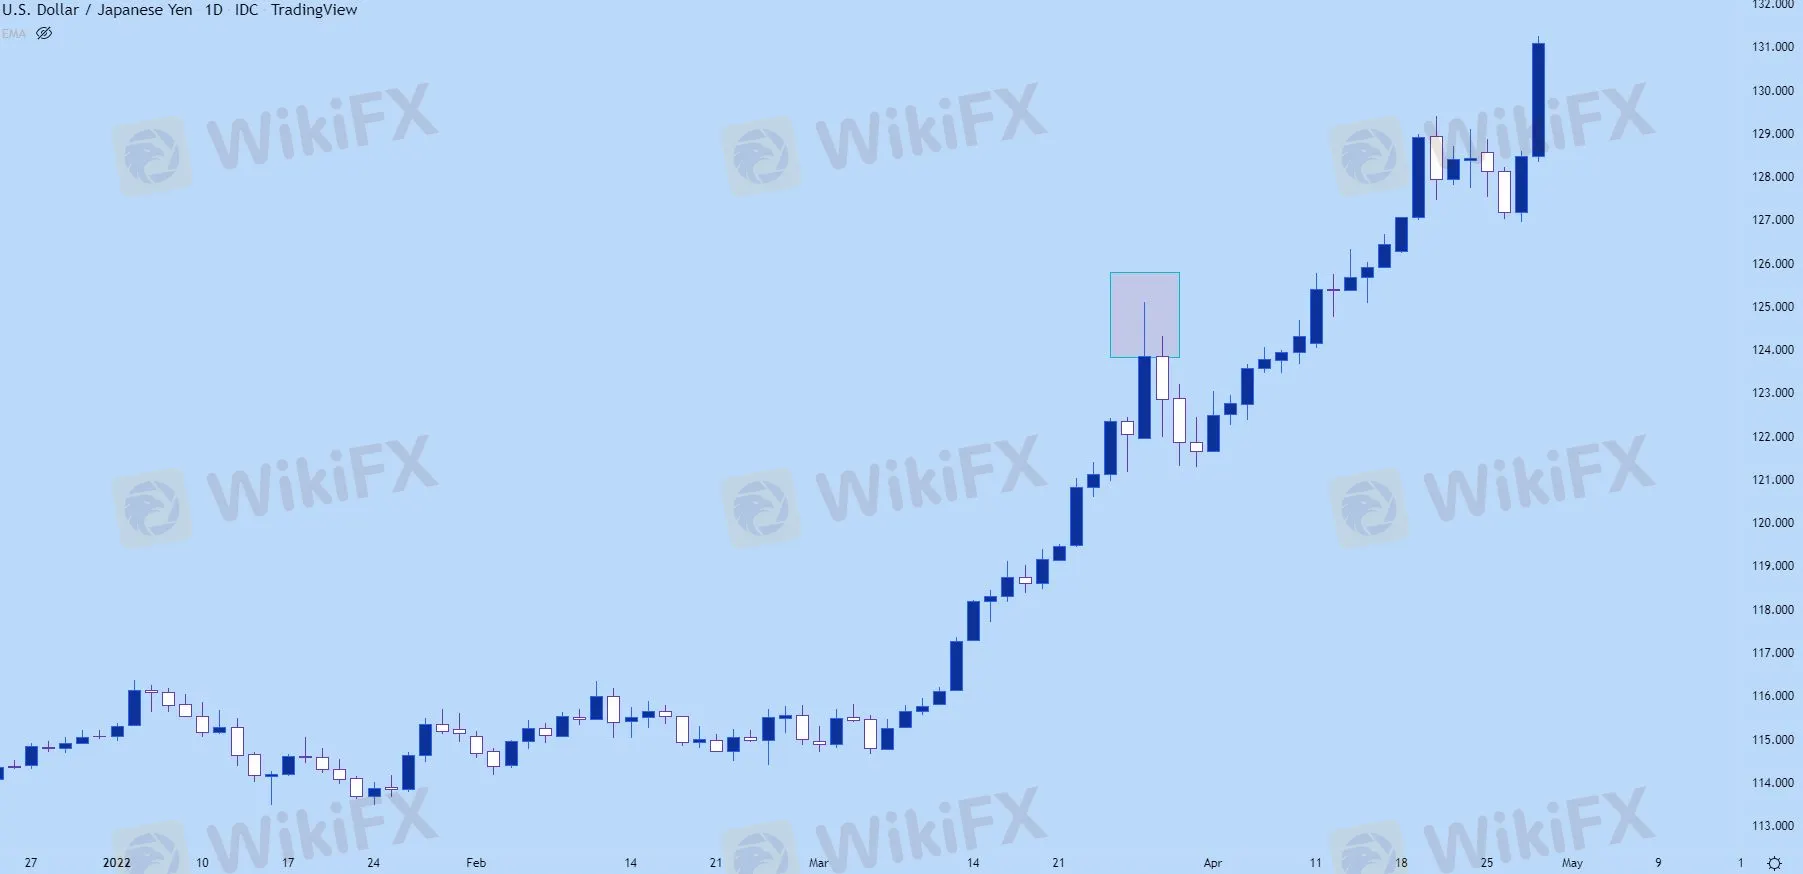
Likely, this will illustrate as a wick sitting atop that daily bar indicating the reversal that had taken place. On the below daily chart of USD/JPY, Ive identified such an extended wick, and notice that the three days that followed continued to see prices pull back despite a very strong trend that led into the move.
USD/JPY Daily Price Chart
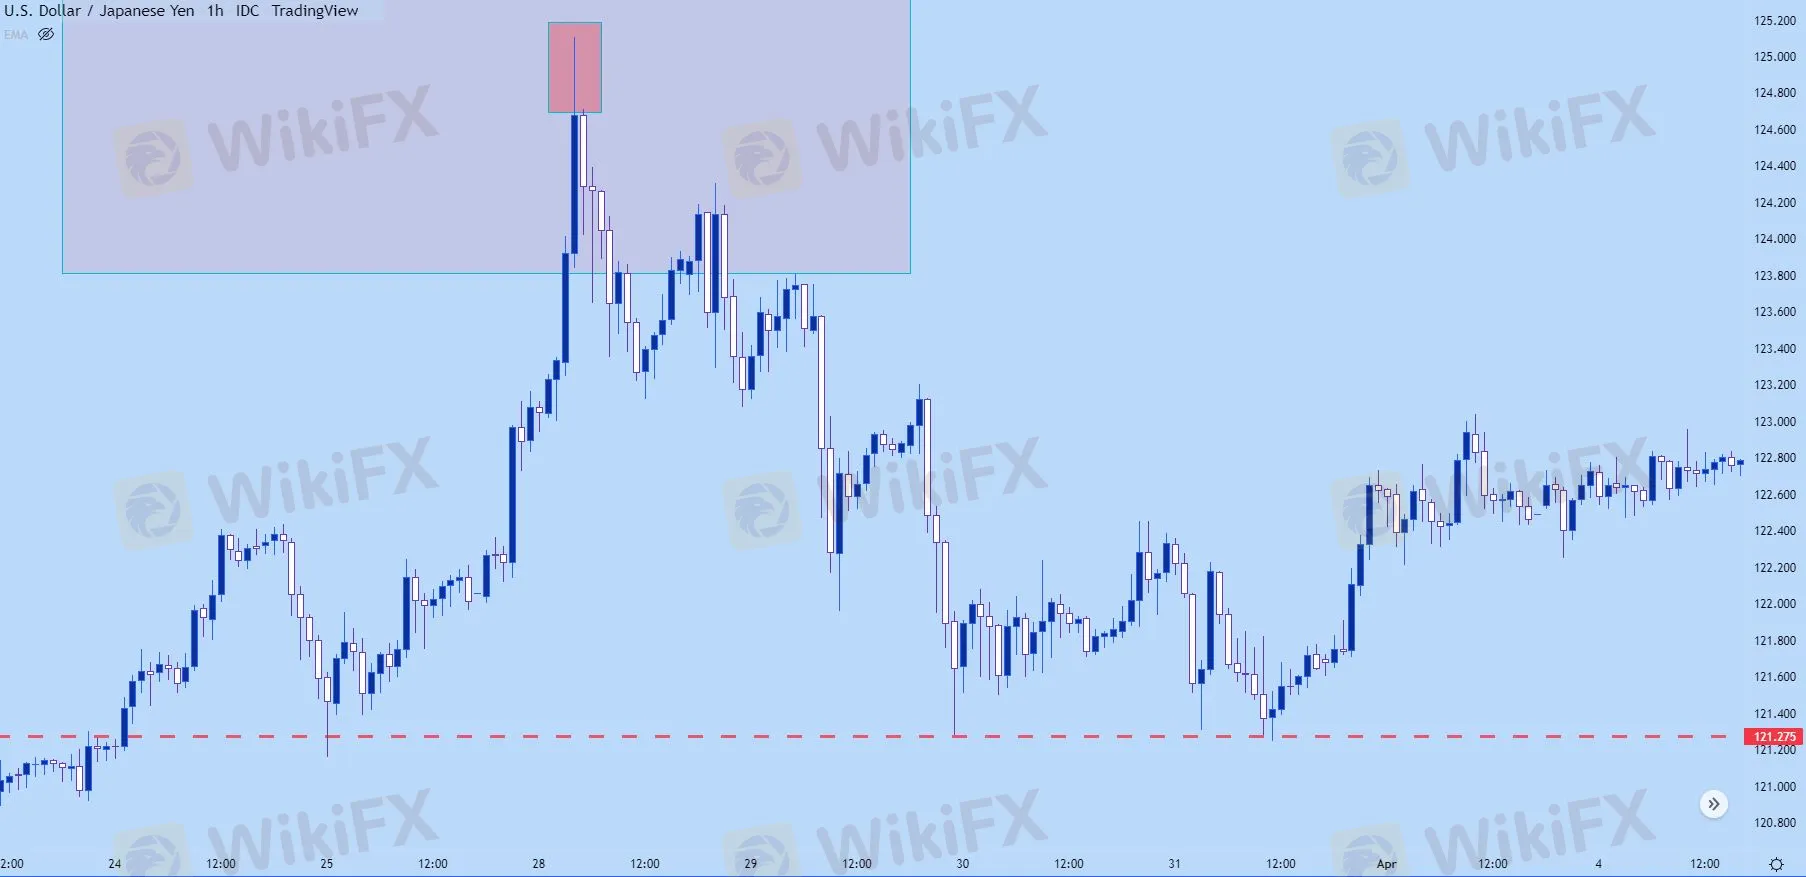
On the below hourly chart, were taking a closer look at that same iteration and we can see that there was an extended upper wick there, as well, albeit much smaller than the wick that showed on the daily.
That three day sell-off started from a fairly clear reversal that had even showed on the hourly chart.
What‘s going on here: Likely there was a catalyst of some type that started a fast reversal and this is simply the playing out of that new ’bearish‘ factor getting priced-in. And, as we looked price action trends, trends do not move in a linear manner, its often a sequencing of ’two steps forward, one step back,‘ and that’s showing in the below example after the reversal began as ‘two steps down, one step up.’
USD/JPY Hourly Price Chart
You might notice on the above chart, the red line along the bottom. Well that‘s pretty key for support and resistance identification when using price action, and we’ll dig into that in our next article on the topic.

Disclaimer:
The views in this article only represent the author's personal views, and do not constitute investment advice on this platform. This platform does not guarantee the accuracy, completeness and timeliness of the information in the article, and will not be liable for any loss caused by the use of or reliance on the information in the article.
Read more
How to Use Retracement in Trading
Understanding retracement is essential for strategic trading. In today’s article, we will focus on the retracement is a temporary, short-lived pullback in the price of a financial instrument, like a stock or an index, that occurs within a larger, established trend. Think of it as a brief pause or a correction before the market continues its original movement. Unlike a trend reversal, which signals a fundamental shift in direction, a retracement represents a temporary deviation that doesn't jeopardize the long-term trend.
What Is Indices in Forex? A Beginner’s Guide to Trading Forex Indices
Understand what indices in forex are, how DXY works, key differences vs pairs, pros/cons, and where to trade CFDs—beginner-friendly, expert-backed guide.

Malaysian Finfluencers Could Face RM10 Million Fine or 10 Years in Prison!
A new regulatory measure by the Securities Commission Malaysia (SC) is set to change the country’s online trading and financial influencer landscape. Starting 1 November 2025, any trader or influencer caught promoting an unlicensed broker could face a fine of up to RM10 million, a prison sentence of up to 10 years, or both.

Juno Markets: A Closer Look at Its Licenses
When selecting a broker, understanding its regulatory standing is an important part of assessing overall reliability. For traders seeking to protect their capital, ensuring that a platform operates under recognised and stringent oversight can make all the difference. Keep reading to learn more about Juno Markets and its licenses.
WikiFX Broker
Currency Calculator

