简体中文
繁體中文
English
Pусский
日本語
ภาษาไทย
Tiếng Việt
Bahasa Indonesia
Español
हिन्दी
Filippiiniläinen
Français
Deutsch
Português
Türkçe
한국어
العربية
Max Drawdown vs. Recovery: Why Drawdown in Trading Can Make or Break You
Abstract:Are you curious about drawdown in trading? Learn how drawdown affects your investments, the risks associated with maximum drawdown, and strategies to manage drawdown in trading. Discover why maximum drawdown is important in a drawdown fund and how to safeguard your portfolio against severe losses. Master smarter trading today!
Are you curious about drawdown in trading? Learn how drawdown affects your investments, the risks associated with maximum drawdown, and strategies to manage drawdown in trading. Discover why maximum drawdown is important in a drawdown fund and how to safeguard your portfolio against severe losses. Master smarter trading today!
What is Drawdown in Trading?
Drawdown refers to the decline in the value of an investment portfolio, trading account, or asset price from its highest historical peak to its lowest point, expressed either as a percentage or an absolute amount. The drawdown persists until the price surpasses its previous peak. The maximum drawdown (MDD) is the maximum loss magnitude from the peak to the lowest point within the statistical period, reflecting the risk level in the worst-case scenario.
Example:
An investor starts with $10,000. Over a year, the investment grows to a peak of $15,000, representing a 50% return. However, due to shifting market conditions, the value then drops to $12,000. Despite still being in profit, the investor experiences a 20% drawdown from the peak.
Maximum Drawdown Formula
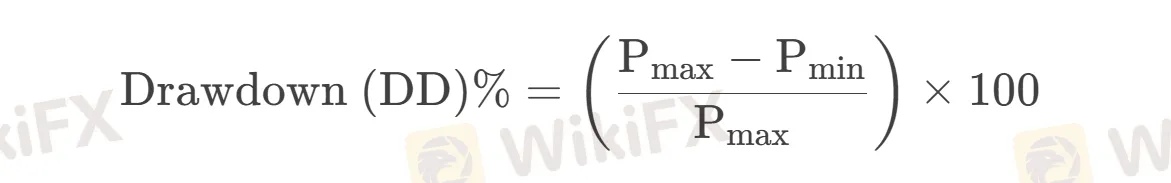
Where:
- Pmax = Highest historical peak
- Pmin = Lowest point after the peak

Advantages and Limitations of Drawdown Analysis
Drawdowns measure peak-to-trough declines, offering investors crucial risk insights. Their key advantage lies in quantifying worst-case historical losses — a 20% drawdown signals potential 20% capital erosion—helping assess risk tolerance. When evaluating strategies, drawdowns reveal risk efficiency: during the 2020 crash, conservative portfolios often saw half the drawdowns of aggressive ones despite similar bull-market returns. Asset allocators benefit too—a 60/40 stock-bond mix typically shows 25-35% smaller drawdowns than pure equity portfolios.
However, drawdowns have limitations. They're rearview mirrors—the COVID-19 crash exceeded most historical drawdown records. They can't time markets; the 2008 crisis looked like a routine correction until it wasn't. Most critically, they ignore liquidity risks—REITs' reported drawdowns often underestimate real losses during fire sales. Savvy investors always pair drawdown analysis with stress tests and liquidity metrics.
| Dimension | Core Characteristics | Functional Value | Typical Scenario Cases | Key Limitations |
| Risk Quantification | Peak-to-trough decline visualization | Provides maximum potential loss reference | 20% drawdown = 20% portfolio value erosion | Only reflects historical extremes |
| Strategy Evaluation | Risk-adjusted return comparison | Identifies more robust strategies with equal returns | Conservative strategies show 40 %+ smaller drawdowns in bear markets | Requires complementary metrics like the Sharpe ratio |
| Asset Allocation | Cross-asset correlation analysis | Builds drawdown-resistant portfolios | Stock-bond portfolios reduce drawdowns by 25%-35% vs. pure equity | Requires dynamic rebalancing |
| Data Dependency | Historical path dependenceThe | Backtesting foundation | The COVID-19 crisis exceeded most historical drawdown records | Needs forward-looking stress tests |
| Trend Analysis | No turning point prediction | Post-risk confirmation | Cannot distinguish the 2008 financial crisis from normal corrections | Requires volatility index supplements |
| Risk Coverage | Single-dimension metric | Focuses on market value fluctuation risk | REITs drawdown data excludes liquidity crunch risks | Needs regulatory metrics like LCR |
Identifying the Type of Drawdown
“Every single trader that puts on risk is going to run into a buzzsaw. It's inevitable. The more screen time you get and the more hands the market gives you, the more you will run into a buzzsaw. You would rather not turn a paper cut into a severed head.” - Dan Shapiro.
Drawdown can come in many different forms. The most important aspect of exiting a drawdown period is to identify what is causing it.
- Emotional Errors
- Strategic Errors
- Basic Probability
Lack of identification can lead the trader to think their drawdown is due to basic probability, which may cause them to employ a “Martingale” strategy (doubling down after a loss).
| Emotional Errors | Strategic Errors |
| Overtrading | Failure to Adapt to Market Conditions |
| Revenge Trading | Lack of Understanding Technical/Fundamental Edge |
| Ignoring Stop Losses | Impatience |
| Chasing Winners/Losers | Poor Discipline |
| Panic | Overleveraging |
| Confirmation Bias | Failure to Have a Clear Exit Strategy |
| Herd Mentality | Inadequate Backtesting and Analysis |
| Overconfidence |
How to Manage Drawdowns: Practical Strategies for Smart Investors
Drawdowns dont ruin traders—unmanaged drawdowns do. Drawdowns are an inevitable part of trading, but how you respond determines long-term success. Here are proven methods to control losses and protect your capital:
✅Define Clear Risk Parameters
To protect your capital, set a strict loss limit per trade (e.g., 1-2% of account equity) and adhere to it without exception. Proprietary traders must follow their firm‘s predefined risk rules. Additionally, study your strategy’s worst historical drawdown—if it has dropped 20% in the past, prepare psychologically and financially for potentially deeper losses.
✅Reduce Leverage During Drawdowns
When facing account losses, the prudent approach is to proactively reduce leverage. For instance, consider a $100 account representing 100% equity—if losses occur, cutting leverage by 20-30% effectively preserves remaining capital. This strategy works because smaller position sizes flatten the equity curve's volatility, buying crucial time for market recovery. Ignoring this principle may lead to margin calls or even accounting liquidation.

✅Use Stop-Losses Religiously
Automated stop-losses (set 5-8% below entry) objectively cut losing trades before emotions interfere. For winning positions, trail your stops to protect profits as the market moves. This lets winners run while securing gains. These disciplined techniques remove guesswork, ensuring you exit trades systematically rather than emotionally.
✅Diversify Strategically
Smart investors spread capital across uncorrelated assets (stocks, bonds, commodities) and strategies (swing trading, algorithmic systems) to reduce portfolio volatility. Remember: even “safe” blue-chip stocks can plummet—never bet everything on a single trade.
✅Stress-Test Your Strategy
Every trading system should be backtested through historic crashes (like 2008's financial crisis or 2020's pandemic plunge) to reveal its true risk profile. If simulated drawdowns exceed your comfort zone, refine position sizes or entry criteria before risking real capital. This disciplined approach separates robust strategies from fair-weather systems that crumble under pressure.
Conclusion
Drawdowns measuring peak-to-valley declines are inevitable but manageable. Savvy traders track drawdown patterns and implement risk controls (position sizing, diversification) to enhance portfolio resilience. Long-term investors may tolerate higher drawdowns for greater returns, while those nearing retirement should prioritize stability.
Drawdowns FAQs
What is an Appropriate Drawdown?
Drawdown tolerance varies by risk appetite. Aggressive traders withstand higher drawdowns than conservative investors. Professionals recommend capping drawdowns at 20%—this safeguards capital while allowing market participation. Maintaining this limit promotes disciplined trading and long-term account preservation.
What is the Difference Between Drawdown in Trading and Drawdown in Banking?
In investing, drawdown measures the peak-to-trough decline in account equity (e.g., 1M dropping to 800K = 20% drawdown), directly reflecting portfolio risk. In banking, it tracks credit utilization (e.g., a 600K drawdown on a 1M line = a 60% drawdown), monitoring liability exposure. While calculated similarly, they represent asset-side and liability-side risk management, respectively.
How to Minimize Your Trading Losses?
Diversification builds resilience, like mutual funds do, trading some return potential for stability. Leverage demands caution, especially with CFDs' 1:1000 ratios where losses compound rapidly. Prudent position sizing contains risk during volatile periods, while automated stops (loss/take-profit) enforce discipline. Together, these form an essential defense against excessive drawdowns.
Disclaimer:
The views in this article only represent the author's personal views, and do not constitute investment advice on this platform. This platform does not guarantee the accuracy, completeness and timeliness of the information in the article, and will not be liable for any loss caused by the use of or reliance on the information in the article.
WikiFX Broker
Latest News
WEEKLY SCAM BROKERS LIST IS OUT! Check it now
 WikiFX
Apex Trader Funding is an Unregulated Firm | You Must Know the Risks
WikiFXWhat WikiFX Found When It Looked Into Aron Markets
WikiFXTextiles to whisky: U.K.–India 'historic' deal is set to boost bilateral trade by over $34 billion a year
WikiFXThailand-Cambodia border clashes: Cambodia's economy has more to lose, analysts say
WikiFXPuma shares plunge 18% after full-year sales, profit outlook cut on U.S. tariffs
WikiFXIs Your Forex Strategy Failing? Here’s When to Change
WikiFXFSMA Warns That Some Firms Operate as Pyramid Schemes
WikiFXFederal Reserve likely to hold interest rates steady despite pressure from Trump. Here's what that means for your money
WikiFXSigma-One Capital Scam? Investors Say They Can’t Withdraw Funds
WikiFXCurrency Calculator

