简体中文
繁體中文
English
Pусский
日本語
ภาษาไทย
Tiếng Việt
Bahasa Indonesia
Español
हिन्दी
Filippiiniläinen
Français
Deutsch
Português
Türkçe
한국어
العربية
Crude Oil Price Latest: Positive Bias on Heightened Political Woes

abstrak:Crude oil continues to trade at lofty levels as worries over the political backdrop in Libya and Venezuela remain at elevated levels.
Crude Oil Price Chart and Analysis:
Crude oil chart continues to flash positive signals.
Libyan oil production at risk as violent clashes continue.
The Brand New DailyFX Q2 2019 Trading Forecast and Guides are Available to Download Now!!
Crude oil prices continue to trade at or near multi-month highs as clashes in Libya continue, adding to concerns that oil production from the OPEC member may be cut back sharply. The ongoing assault on the capital Libya has yet to weigh on current oil production of round 1.1 million barrels per day but this could change quickly, impacting the price of crude.
Sanctions against Venezuela continue to bite with the country reporting a sharp slowdown in production. According to the IEA the country‘s production was down 600,000 barrels a day compared to a year ago, while OPEC reported that Venezuela’s monthly production fell by around 500,000 barrels to 960,000 barrels last month.
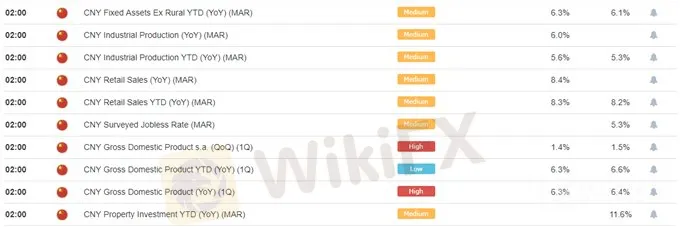
Crude is also being propped up by thoughts that the economic slowdown in China is not as bad as first feared with traders now waiting for a slew of economic data on Wednesday, including Chinese Q1 GDP. Data last week showed new Yuan loans rising sharply in March to 1690 billion from 885.8 billion, while the trade balanced soared to CNY 221.3 billion from 34.46 billion in February.
DailyFX analyst Daniel Dubrovsky will be covering Chinese GDP Data live on April 17 from 2:45am.
The current oil chart remains positive with prices seemingly supported by the 38.2% Fibonacci retracement level at $70.57/bbl. and the 200-day moving average further down at $68.50/bbl. The 20-day moving average rose though the longer-dated ma at the start of April and this has added another positive sign on the current chart. The market has moved out of extreme oversold territory and is sitting on the recent bullish trend line.
How to Trade Oil: Crude Oil Trading Strategies & Tips.
Crude Oil Daily Price Chart (June 2018 – April 15, 2019)

Disclaimer:
Ang mga pananaw sa artikulong ito ay kumakatawan lamang sa mga personal na pananaw ng may-akda at hindi bumubuo ng payo sa pamumuhunan para sa platform na ito. Ang platform na ito ay hindi ginagarantiyahan ang kawastuhan, pagkakumpleto at pagiging maagap na impormasyon ng artikulo, o mananagot din para sa anumang pagkawala na sanhi ng paggamit o pag-asa ng impormasyon ng artikulo.
Broker ng WikiFX
Exchange Rate

