简体中文
繁體中文
English
Pусский
日本語
ภาษาไทย
Tiếng Việt
Bahasa Indonesia
Español
हिन्दी
Filippiiniläinen
Français
Deutsch
Português
Türkçe
한국어
العربية
Gold Price Chart Hints at Topping Before Fed Policy Announcement

एब्स्ट्रैक्ट:Gold prices may be carving out a topping chart pattern. Soundbites form an OPEC+ meeting and EIA drilling data may highlight competing influences on crude
GOLD & CRUDE OIL TALKING POINTS:
Gold price technical positioning hints a top may be taking shape
Crude oil prices struggle at chart resistance as OPEC+ convene
S&P 500 futures hint at risk-on bias, EIA drilling report on ta
Gold prices edged up Friday as the US Dollar weakened and Treasury bond yields fell, boosting the appeal of anti-fiat and non-interest-bearing assets. Crude oil prices swung in a choppy range as OPEC+ officials prepared to meet in Baku, Azerbaijan to discuss progress on coordinated output cuts, with traders pondering the possibility that they might be extended past the current mid-year expiration date.
GOLD EYES RISK TRENDS, OIL FOCUSED ON OPEC+ MEETING & EIA REPORT
From here, a relatively quiet offering on the economic calendar may put sentiment trends at the forefront. A cautiously upbeat mood in Asia Pacific trade has nudged up bond yields alongside shares, pressuring gold downward. Bellwether S&P 500 futures are pointing gently higher, hinting that more of the same might be in the cards ahead. Follow-through may be limited ahead of Wednesdays FOMC meeting however.
Meanwhile, oil traders will continue eyeing soundbites from Baku as supporters of extending supply caps – notably, Saudi Arabia – spar with skeptics like Russia and Iraq. Against this backdrop, the monthly EIA Drilling Productivity Report may show that US production continues to swell, threatening to derail OPEC-driven de-stocking efforts. That might weigh on prices.
Learn what other traders gold buy/sell decisions say about the price trend!
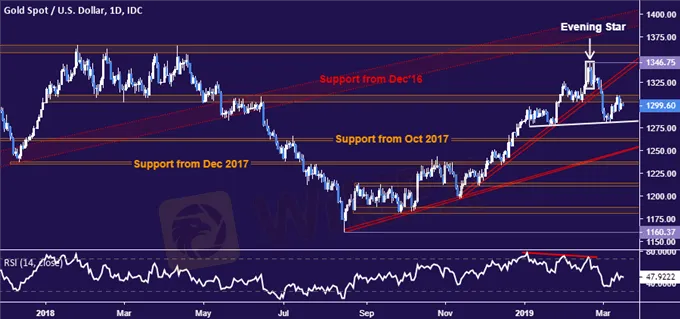
GOLD TECHNICAL ANALYSI
Gold prices pulled back from support-turned-resistance in the 1303.70-10.95 area, with overall positioning hinting that a (somewhat malformed) Head and Shoulders top might be taking shape. Confirmation is required on a break of neckline support, now at 1281.91. If that is breached on a daily closing basis, the 1260.80-63.76 zone is exposed initially but the overall setup implies a measured downside objective near 1220. Alternatively, a move above 1310.95 sets the stage to revisit the February swing top at 1346.75.
CRUDE OIL TECHNICAL ANALYSI
Crude oil prices are testing resistance in the 57.96-59.05 area. Negative RSI divergence warns of ebbing upside momentum and hints a turn lower may be brewing ahead. Confirmation requires a daily close below the 54.55-55.66 support band, which would then expose the 50.15-51.33 zone. Alternatively, a push above resistance exposes the underside of former support set from February 2016, now at 62.63.

अस्वीकरण:
इस लेख में विचार केवल लेखक के व्यक्तिगत विचारों का प्रतिनिधित्व करते हैं और इस मंच के लिए निवेश सलाह का गठन नहीं करते हैं। यह प्लेटफ़ॉर्म लेख जानकारी की सटीकता, पूर्णता और समयबद्धता की गारंटी नहीं देता है, न ही यह लेख जानकारी के उपयोग या निर्भरता के कारण होने वाले किसी भी नुकसान के लिए उत्तरदायी है।
WikiFX ब्रोकर
WikiFX ब्रोकर
रेट की गणना करना

