简体中文
繁體中文
English
Pусский
日本語
ภาษาไทย
Tiếng Việt
Bahasa Indonesia
Español
हिन्दी
Filippiiniläinen
Français
Deutsch
Português
Türkçe
한국어
العربية
Asia Stocks Trim Some of Recent Gains as Nikkei 225 Uptrend Holds

एब्स्ट्रैक्ट:Asia Pacific stocks slightly trimmed their recent gains as the FOMC neared. The Nikkei 225s uptrend is still intact, held together by rising support from the beginning of this year.
Asia Pacific Markets Wrap Talking Points
Asia stocks slightly trimmed gains as FOMC nears
European ZEW sentiment surveys may disappoint
Nikkei 225 uptrend still holds on rising support
Find out what retail traders equities buy and sell decisions say about the coming price trend!
Asia Pacific equities traded cautiously lower on Tuesday, failing to find much significant follow-through after a rosy session on Wall Street. The Nikkei 225 aimed more than 0.2% lower, along with similar weakness from the Shanghai Composite. The ASX 200 was narrowly down, declining over 0.1% heading into the close while the KOSPI met a similar fate.
Taking a look at currencies reveal a similar response when considering sentiment. As one might expect, the anti-risk Japanese Yen aimed cautiously higher against its major counterparts. Meanwhile, the risk-oriented Australian and New Zealand Dollars were a little bit weaker. After a few days of gains in equities, markets appear to be experiencing a slight dose of correction ahead of this weeks Fed rate decision.
As the FOMC nears, sustainable technical breakthroughs me be hard to find in the major currencies and global indexes. It is such a high-risk event with knock-on effects that can span markets worldwide. Brexit updates do remain a wildcard for the British Pound though. Ahead, keep an eye on German and Eurozone ZEW sentiment surveys. European economic growth slowing may result in softer-than-expected outcomes.
Nikkei 225 Technical Analysis
Using futures to show after hours-trade, the Nikkei 225 is still being supported by a rising range from the beginning of this year (pink parallel lines on the chart below). Prices have attempted multiple times to breach this area since last week and it appears to be holding up. A descent through it does open the door to a turn lower, perhaps to the next immediate support area at 20973. Resistance seems to be at 21890.
Nikkei 225 Daily Chart
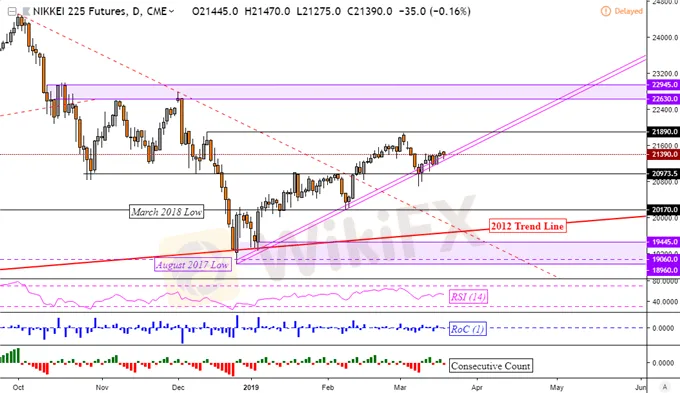
Chart Created in TradingView
अस्वीकरण:
इस लेख में विचार केवल लेखक के व्यक्तिगत विचारों का प्रतिनिधित्व करते हैं और इस मंच के लिए निवेश सलाह का गठन नहीं करते हैं। यह प्लेटफ़ॉर्म लेख जानकारी की सटीकता, पूर्णता और समयबद्धता की गारंटी नहीं देता है, न ही यह लेख जानकारी के उपयोग या निर्भरता के कारण होने वाले किसी भी नुकसान के लिए उत्तरदायी है।
WikiFX ब्रोकर
रेट की गणना करना

