简体中文
繁體中文
English
Pусский
日本語
ภาษาไทย
Tiếng Việt
Bahasa Indonesia
Español
हिन्दी
Filippiiniläinen
Français
Deutsch
Português
Türkçe
한국어
العربية
Oil Price Outlook: Crude Spills into Support – WTI Trade Levels

एब्स्ट्रैक्ट:Oil prices plummeted more than 15% from the July highs with crude now threatening a break of the June lows. Here are the levels that matter on the WTI technical charts.
Crude Oil price collapses towards June lows- focus is on a close around 51.03/67
Check out our 2019 projections in our Free DailyFX Crude Oil Trading Forecasts
Join Michael for Live Weekly Strategy Webinars on Mondays at 12:30GMT
Crude Oil Prices have plummeted more than 15% off the June highs with WTI now probing a key support zone near the June close lows. These are the updated targets and invalidation levels that matter on the crude oil price charts (WTI). Review this week's Strategy Webinar for an in-depth breakdown of this oil price setup and more.
New to Oil Trading? Get started with this Free How to Trade Crude Oil Beginners Guide
Crude Oil Price Chart - WTI Daily
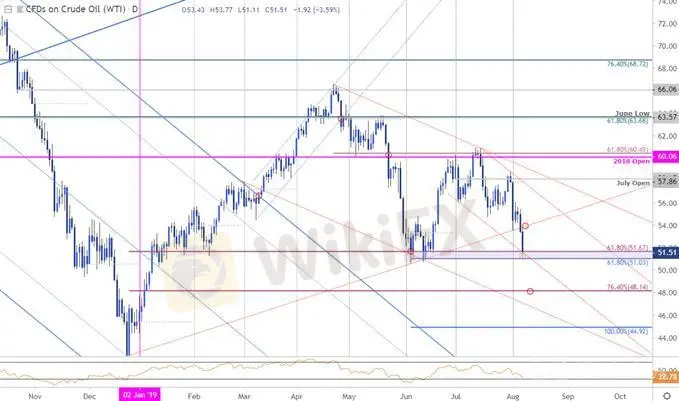
Technical Outlook: In my latest Oil Price Weekly Outlook we highlighted the continued downside risk in WTI while noting that a break below support at 54.53 was, “needed to mark resumption targeting 51.60 backed by more significant support at the January reversal close at 48.24- look for a bigger reaction there IF reached.” Price is probing confluence support today at 51.03/67- a region defined by the 61.8% retracement of the late-2018 advance and the 61.8% extension of the decline off the yearly high- looking for a reaction here.
Crude Oil Price Chart – WTI 240min

Notes: A closer look at oil price action shows WTI trading within the confine of a descendingpitchfork formation extending off the June / July highs with an embedded channel off last weeks high continuing to govern price action. A break below this threshold keeps the focus on subsequent support objectives around ~50.08 and the lower parallel / 48.14/24. Initial resistance now 52.58 backed by 53.75 – bearish invalidation now lowered to the weekly open at 55.21.
Learn how to Trade with Confidence in our Free Trading Guide
Bottom line: The oil price sell-off is testing support targets here at 51.03/67 – watch today‘s close. From a trading standpoint, a good spot to trim short-exposure / lower protective stop. We’ll be on the lookout for possible downside exhaustion on a stretch lower towards downtrend support.
For a complete breakdown of Michaels trading strategy, review his Foundations of Technical Analysis series on Building a Trading Strategy
Crude Oil Trader Sentiment

A summary of IG Client Sentiment shows traders are net-long Crude Oil - the ratio stands at +1.71 (63.1% of traders are long) – bearish reading
Traders have remained net-long since July 12th; price has moved 14.2% lower since then
Long positions are 8.9% higher than yesterday and 11.5% higher from last week
Short positions are 10.8% higher than yesterday and 7.8% lower from last week
We typically take a contrarian view to crowd sentiment, and the fact traders are net-long suggests Oil - US Crude prices may continue to fall. Yet positioning is less net-long than yesterday but more net-long from last week andthe combination of current positioning and recent changes gives us a further mixed Oil price trading bias from a sentiment standpoint.
अस्वीकरण:
इस लेख में विचार केवल लेखक के व्यक्तिगत विचारों का प्रतिनिधित्व करते हैं और इस मंच के लिए निवेश सलाह का गठन नहीं करते हैं। यह प्लेटफ़ॉर्म लेख जानकारी की सटीकता, पूर्णता और समयबद्धता की गारंटी नहीं देता है, न ही यह लेख जानकारी के उपयोग या निर्भरता के कारण होने वाले किसी भी नुकसान के लिए उत्तरदायी है।
WikiFX ब्रोकर
रेट की गणना करना

