简体中文
繁體中文
English
Pусский
日本語
ภาษาไทย
Tiếng Việt
Bahasa Indonesia
Español
हिन्दी
Filippiiniläinen
Français
Deutsch
Português
Türkçe
한국어
العربية
Crude Oil Price Drop May Resume as Risk Appetite Evaporates

एब्स्ट्रैक्ट:Crude oil prices may succumb to selling pressure once again after a brief respite as trade war worries push markets to reduce exposure ahead of the weekend.
CRUDE OIL & GOLD TALKING POINTS:
Crude oil prices may break below support near $50/bbl figure
Trade war worries may inspire liquidation before the weekend
Gold price rise may be capped as haven flows lift US Dollar
Benchmark commodity prices idled through a lull in market-moving event risk Thursday, as expected. From here, a broadly defensive mood may prevail in the final hours of the trading week as sentiment trends overshadow a lackluster offering on the economic data docket.
Cycle-sensitive crude oil prices look vulnerable against this backdrop. The release of an EIA monthly report that downgrades demand expectations amid global slowdown even as US output remains near record highs might help to compound selling pressure.
Gold prices may get a lift from lower bond yields in this scenario as capital flows to the safety of government bonds. A higher premium on liquidity amid divestment might also buoy the US Dollar, tarnishing the appeal of anti-fiat alternatives and holding back the yellow metal from a more substantive advance.
Get our free guide to help build confidence in your gold and crude oil trading strategy!
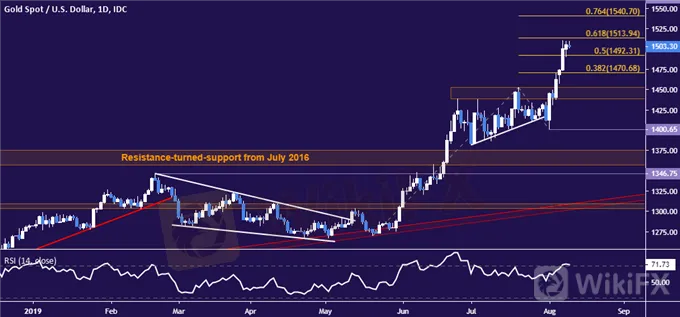
GOLD TECHNICAL ANALYSIS
Gold prices paused to consolidate gains below resistance at 1513.94, the 61.8% Fibonacci expansion. A break above this barrier on a daily closing basis exposes the 76.4% level at 1540.70 next. Alternatively, a reversal lower that brings prices below the 50% Fib at 1492.31 targets the 38.2% expansion at 1470.68 thereafter.
Gold price chart created using TradingView
CRUDE OIL TECHNICAL ANALYSIS
Crude oil prices are testing support 49.41-50.60 area. A daily close below that opens the door to challenge a floor in play since September 2016 in the 42.05-43.00 zone. Alternatively, a turn back above 56.09 aims for back-to-back trend line and congestion region barriers running upward through 60.84.
.

Crude oil price chart created using TradingView
COMMODITY TRADING RESOURCES
See our guide to learn about the long-term forces driving crude oil prices
Having trouble with your strategy? Heres the #1 mistake that traders make
Join a free webinar and have your commodity market questions answered
अस्वीकरण:
इस लेख में विचार केवल लेखक के व्यक्तिगत विचारों का प्रतिनिधित्व करते हैं और इस मंच के लिए निवेश सलाह का गठन नहीं करते हैं। यह प्लेटफ़ॉर्म लेख जानकारी की सटीकता, पूर्णता और समयबद्धता की गारंटी नहीं देता है, न ही यह लेख जानकारी के उपयोग या निर्भरता के कारण होने वाले किसी भी नुकसान के लिए उत्तरदायी है।
WikiFX ब्रोकर
WikiFX ब्रोकर
रेट की गणना करना

