简体中文
繁體中文
English
Pусский
日本語
ภาษาไทย
Tiếng Việt
Bahasa Indonesia
Español
हिन्दी
Filippiiniläinen
Français
Deutsch
Português
Türkçe
한국어
العربية
Oil Price Outlook: Crude Reversal Targets – WTI Trade Levels

एब्स्ट्रैक्ट:Oil prices have rallied more than 5% since the start of the week – is a near-term low in place? Here are the levels that matter on the WTI weekly chart.
Oil pricereverses more than 13% off the monthly lows– rally targets August open
Check out our 2019 projections in our Free DailyFX Oil Price Trading Forecasts
Join Michael for Live Weekly Strategy Webinars on Mondays at 12:30GMT
Oil prices are attempting to snap a two-week losing streak after turning sharply from monthly support last week. The advance may have further to go but keeps price within the confines of the broader downtrend. These are the updated targets and invalidation levels that matter on the oil weekly price chart (WTI). Review my latestWeekly Strategy Webinar for an in-depth breakdown of this US Dollar trade setup and more.
New to Oil Trading? Get started with this Free How to Trade Crude Oil Beginners Guide
Oil Price Chart – WTI Weekly
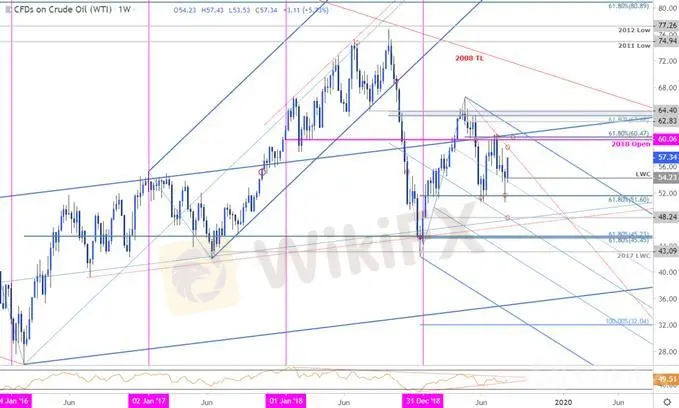
Notes: In my last Oil PriceOutlook we noted that, “The oil price sell-off is testing support targets here at 51.03/67,” while warning to, “be on the lookout for possible downside exhaustion.” WTI briefly registered a low at 50.51 before turning sharply higher with the advance now approaching the August open at 57.89. Note that weekly momentum has continued to range into the apex of this consolidation pattern- look to the break for guidance.
Initial resistance is eye at the April trendline with key resistance steady at 60.06/47 – a breach / close above this threshold would be needed to suggest a larger breakout is underway. Initial support now rests with the low-week close at 54.23 with a break / close below the 61.8% retracement at 51.60 needed to mark resumption of the broader downtrend, targeting 48.24.
For a complete breakdown of Michaels trading strategy, review his Foundations of Technical Analysis series on Building a Trading Strategy
Bottom line: Oil prices turned support last week with the recent price breakout now approaching initial resistance targets. From a trading standpoint, look to reduce long-exposure / raise protective stops on a rally towards the monthly open / trendline resistance. Ultimately, we‘re treating this as a range for now- don’t chase this just yet. Ill publish an updated Crude Oil Price Outlook once we get further clarity in near-term price action.
Crude Oil Trader Sentiment

A summary of IG Client Sentiment shows traders are net-long Oil - the ratio stands at +1.64 (62.1% of traders are long) – bearish reading
Traders have remained net-long since July 12th; price has moved 3.1% lower since then
Long positions are 18.9% lower than yesterday and 11.8% lower from last week
Short positions are 11.4% lower than yesterday and 6.0% lower from last week
We typically take a contrarian view to crowd sentiment, and the fact traders are net-long suggests crude oil prices may continue to fall. Yet traders are less net-long than yesterday and compared with last week. Recent changes in sentiment warn that the current Oil - US Crude price trend may soon reverse higher despite the fact traders remain net-long.
See how shifts in Crude Oil retail positioning are impacting trend- Learn more about sentiment!
---
Previous Weekly Technical Charts
Canadian Dollar (USD/CAD)
US Dollar (DXY)
Gold (XAU/USD)
Crude Oil (WTI)
Aussie (AUD/USD)
EUR/JPY
Silver (XAG/USD)
अस्वीकरण:
इस लेख में विचार केवल लेखक के व्यक्तिगत विचारों का प्रतिनिधित्व करते हैं और इस मंच के लिए निवेश सलाह का गठन नहीं करते हैं। यह प्लेटफ़ॉर्म लेख जानकारी की सटीकता, पूर्णता और समयबद्धता की गारंटी नहीं देता है, न ही यह लेख जानकारी के उपयोग या निर्भरता के कारण होने वाले किसी भी नुकसान के लिए उत्तरदायी है।
WikiFX ब्रोकर
रेट की गणना करना

