简体中文
繁體中文
English
Pусский
日本語
ภาษาไทย
Tiếng Việt
Bahasa Indonesia
Español
हिन्दी
Filippiiniläinen
Français
Deutsch
Português
Türkçe
한국어
العربية

Markets Risk Averse, S&P 500 Net-Short Bets Put Support In Focus
Ikhtisar:Equities are showing signs of risk aversion ahead of testimony from Fed Chair Jerome Powell, though S&P 500 net-short positioning may precede a turn higher as support looms.
Asia Pacific Markets Talking Points
Stocks trade lower in Asia after disappointing US session
Markets seem to be nervous ahead of the Powell testimony
S&P 500 fall facing roadblock, net-short positioning rises
Find out what retail traders equities buy and sell decisions say about the coming price trend!
Stocks traded mostly lower in Tuesday Asia Pacific trade, echoing the nervous behavior from the prior Wall Street trading session. Absent a major catalyst in a relatively quiet session, markets seemed to be anxiously awaiting this weeks testimony from Fed Chair Jerome Powell and the latest FOMC meeting minutes.
China‘s Shanghai Composite, Australia’s ASX 200 and South Korea‘s benchmark KOSPI declined about 0.6, 0.3 and 0.2 percent to the downside. Meanwhile, Japan’s Nikkei 225 was little changed. There, underperformance in information technology was balanced by a pickup in communication services.
A cautious decline in front-end US government bond yields signaled risk aversion to a certain degree and the haven currency of choice was the highly-liquid US Dollar. On the flip side of the spectrum, the pro-risk Australian Dollar underperformed, particularly against the anti-risk Japanese Yen.
S&P 500 futures remain pointed firmly lower, hinting at a continued deterioration in sentiment to come during European and US trading hours. Countering this performance is an uptick in net-short positioning for the index which is offering a bullish contrarian trading bias.
Join me every week on Wednesdays at 00:00 GMT as I show you what market positioning is revealing about the prevailing trends in markets!
S&P 500 Technical Analysis
Amidst these competing signals, technical analysis shows that the S&P 500 could be heading for a roadblock ahead. What appears to be a potential rising trend line is aligned with former resistance which is a range between 2947 and 2961. If this area holds, there may be a retest of resistance at 3006.
S&P 500 Futures Daily Chart
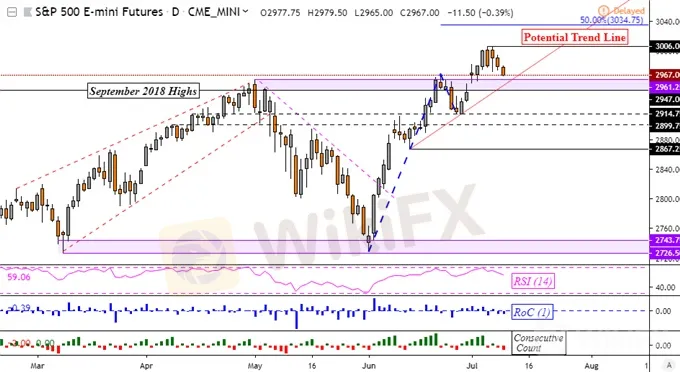
Charts Created in TradingView
Disclaimer:
Pandangan dalam artikel ini hanya mewakili pandangan pribadi penulis dan bukan merupakan saran investasi untuk platform ini. Platform ini tidak menjamin keakuratan, kelengkapan dan ketepatan waktu informasi artikel, juga tidak bertanggung jawab atas kerugian yang disebabkan oleh penggunaan atau kepercayaan informasi artikel.
WikiFX Broker
WikiFX Broker
Berita Terhangat
IMING - IMING 2025 ! Review Trader Indonesia Dikelabui $30 No Deposit Bonus Broker Penipu Greede LTD
 WikiFX
Agen Global WikiFX 2025: Ubah Pencapaian Nyata Menjadi Peluang Bisnis Internasional !
WikiFX3 Broker Dengan Deposit Paling MURAH 2025: Panduan Lengkap Trading Mulai dari Rp10.000
WikiFXApakah YAKIN Aman? Trading Forex di MetaQuotes MetaTrader 4 untuk Pengguna Indonesia 2025
WikiFXMAMPUKAN Menguasai Pola Jam Segitiga: Strategi Trading Lengkap untuk Profit 2025
WikiFXTrader Indonesia ! YUK Tetap Waspada Potensi Kecurangan Broker Olymp Trade 2025
WikiFXPanduan Lengkap Broker Rating 2025: 7 Pilar Cara Memilih Broker Forex Terbaik Untuk Anda
WikiFXNilai Tukar

