简体中文
繁體中文
English
Pусский
日本語
ภาษาไทย
Tiếng Việt
Bahasa Indonesia
Español
हिन्दी
Filippiiniläinen
Français
Deutsch
Português
Türkçe
한국어
العربية
Gold Price Technical Outlook: More Gains on the Cards
概要:The gold price has filled a gap on the daily chart and is now heading higher again, suggesting a continuation of the present uptrend.
Gold price, news and analysis:
黄金价格,新闻和分析:
The price of gold slipped back Monday, filling a gap on the daily chart.
黄金价格周一回落,填补日线图上的差距。
However, it has hit a new six-year high Tuesday and that could mean further gains are on the way.
然而,它已经在周二触及新的六年高点,这可能意味着进一步上涨。
Gold price technical outlook positive
黄金价格技术展望正面
The price of gold fell back Monday, filling a gap on the daily chart (see below). However, it is climbing again Tuesday, reaching a new six-year high and suggesting that the multi-year advance in the price of the precious metal is not yet exhausted.
黄金价格周一回落,填补了日线图上的空白(见下文)。然而,它在周二再次攀升,达到新的六年高位,并暗示贵金属价格多年的上涨尚未用尽。
Currently, the price is above the 20-day moving average, which is above the 50-dma and that in turn is above the 100-dma – suggesting a classic upward trend. Moreover, the 14-day relative strength index, which has flirted with the 70 “overbought” level, is now back below it, adding to the positive chart outlook.
目前,价格高于20日移动平均线,高于50日移动均线,反过来高于100日移动均线 - 表明经典的上升趋势。此外,14日相对强弱指数,已经与70“超买”水平调整,现在回到它之下,增加了正面图表前景。
Gold Price Chart, Daily Timeframe (May 28 – August 7, 2019)
黄金价格走势图,每日时间表(2019年5月28日至8月7日)
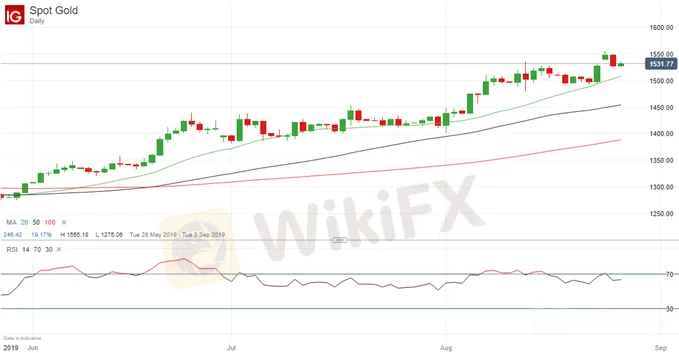
Chart by IG (You can click on it for a larger image)
IG图表(您可以点击它查看大图)
Near-term, there is support for the gold price at last Fridays $1,493.61 low and just above that at $1,507.68, where the 20-dma currently kicks in. For resistance, however, it is necessary to look at the weekly chart below.
近期,上周五黄金价格支撑位于1,493.61美元低点,略高于1,507.68美元,目前20日均线位于该位置。但对于阻力位,有必要查看下方的周线图。
Gold Price Chart, Weekly Timeframe (October 8, 2012 – August 7, 2019)
黄金价格走势图,每周时间范围(2012年10月8日 - 2019年8月7日)

Chart by IG (You can click on it for a larger image)
IG图表(您可以单击它以查看大图)
This shows a high of $1,590.40 in the week of April 8, 2013 and, above that, a high of $1,616.83 in the week of March 8, 2013. These, plus the $1,600 “round number” between them can be regarded as the near-term targets. Note, however, that volume was high when the price fell Monday, despite a bank holiday in the UK, and that can be read as a warning against irrational exuberance.
这显示2013年4月8日当周的高点1,590.40美元,高于1美元的高点,2013年3月8日这一周的16.83。这些以及它们之间1,600美元的“整数”可被视为近期目标。但请注意,尽管英国银行假期,但周一价格下跌时成交量仍然很高,这可以被视为对非理性繁荣的警示。
免責事項:
このコンテンツの見解は筆者個人的な見解を示すものに過ぎず、当社の投資アドバイスではありません。当サイトは、記事情報の正確性、完全性、適時性を保証するものではなく、情報の使用または関連コンテンツにより生じた、いかなる損失に対しても責任は負いません。
WikiFXブローカー
話題のニュース
今週、日本人ユーザーが最も検索されたFX会社まとめ[4月11日]
 WikiFX
【解説】なぜトランプ大統領は「関税強化」を即座に実行できたのか?
WikiFXレート計算

