简体中文
繁體中文
English
Pусский
日本語
ภาษาไทย
Tiếng Việt
Bahasa Indonesia
Español
हिन्दी
Filippiiniläinen
Français
Deutsch
Português
Türkçe
한국어
العربية
Gold Price Struggles, Silver Continues to Test Noted Support

요약:Gold remains near its lowest level in three months and is struggling to get any upside momentum. Silver continues its battle with the long-term moving average.
Gold and Silver Price Analysis and Charts.
Gold struggles as the US dollar remains firm.
Silver – bulls and bears continue to trade blows around the 200-day ma.
DailyFX Q2 Forecasts and Top 2019 Trading Opportunities.
Trading the Gold-Silver Ratio: Strategies and Tips.
Gold Nears Strong Support Levels
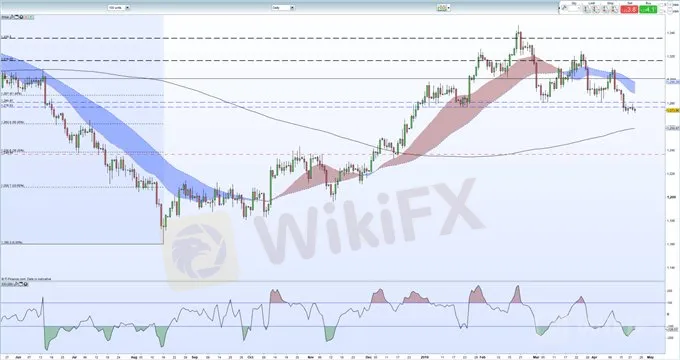
Gold remains under pressure and below a previous support zone between $1,26.8/oz and $1,280.9/oz that broke at the end of last week. The market fundamentals should provide gold with a mild bid as US President Trump ramps up the pressure on Iran by ending the current oil waivers, while the US dollar continues to trade at elevated levels and is susceptible to a sell-off, especially with the first look at US Q1 GDP at the end of the week. Gold should find strong support between $1,262/oz and $1,259/oz, the 50% Fibonacci retracement level and the 200-day moving average respectively. A break above $1,280.9/oz leaves $1,287/oz the first target. The chart continues to highlight lower highs since February 20, while the CCI indicator continues to point to an oversold market.
How to Trade Gold: Top Gold Trading Strategies and Tips.
Gold Daily Price Chart (May 2018 – April 23, 2019)
IG Client Sentimentshows that retail traders are 75.1% net-long gold, a bearish contrarian indicator. In addition, recent daily and weekly sentiment shifts give us a stronger bearish trading bias.
Silver – Supported by the 20-Day Moving Average
Silver continues to test the 200-day moving average, an indicator that has been under pressure since early April. The indicator, currently at $14.96/oz has been broken but not closed below, adding short-term credibility to its support. If we do break and close below, the 23.6% Fibonacci retracement at $14,91/oz will come into play before the April 15 low at $14.85/oz. The CCI indicator shows the metal just moving out of oversold territory.
How to Trade Silver: Top Silver Trading Strategies.
Silver Daily Price Chart (July 2018 – April 23, 2019)

면책 성명:
본 기사의 견해는 저자의 개인적 견해일 뿐이며 본 플랫폼은 투자 권고를 하지 않습니다. 본 플랫폼은 기사 내 정보의 정확성, 완전성, 적시성을 보장하지 않으며, 개인의 기사 내 정보에 의한 손실에 대해 책임을 지지 않습니다.
WikiFX 브로커
환율 계산기

