简体中文
繁體中文
English
Pусский
日本語
ภาษาไทย
Tiếng Việt
Bahasa Indonesia
Español
हिन्दी
Filippiiniläinen
Français
Deutsch
Português
Türkçe
한국어
العربية
Gold Prices Coil within Two-Week Range after US NFP Letdown
요약:The past few days have produced choppy price action in Gold and the US Dollar, but price action after the May Fed meeting may point to near-term resolution.
Gold prices have had a rocky week, between the May Fed meeting and the April US Nonfarm Payrolls report. Fed Chair Jerome Powell came across as more optimistic than people anticipated regarding price pressures, initially sending the US Dollar higher and Gold lower on Wednesday.
Calling low inflation “transitory,” Fed Chair Powell seemingly sidestepped committing to more easing. After all, he has said that the FOMC would consider a policy adjustment if inflation were to be low on a “persistent” basis.
In turn, as the US Dollar and US Treasury yields ran higher on Wednesday and Thursday, Gold prices were knocked lower.
But that momentum was halted today when a superficially strong US jobs report didnt serve as the solidifying factor for sentiment that traders were looking for. Even though the topline figure topped 200K and the unemployment rate fell to a new cycle low, wage growth missed expectations and the labor force participation rate dropped unexpectedly.
Between the May Fed meeting and the April US Nonfarm Payrolls report, prices across asset classes have carved out a range as no clear sentiment has emerged after this week's events.
Gold Price Technical Analysis: Daily Chart (April 2018 to May 2019) (Chart 1)
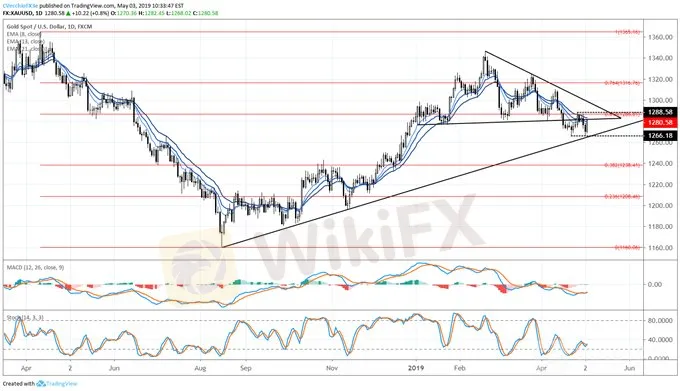
Since setting a fresh yearly low on April 16, gold prices have been moving sideways around former symmetrical triangle support. But as the uptrend from the August, October, and November 2018 lows has come into focus, gold prices have been stuck trading between 1266 and 1288. This coiling effort has shifted attention away from the multi-month symmetrical triangle to the two-week sideways consolidation.
Accordingly, the gold price forecast is necessarily neutral heading into next week: a move below 1266 by mid-May would constitute a downside break of the consolidation as well as the uptrend from the late-2018 swing lows; while a move above 1288 by mid-May would constitute a topside break of the consolidation as well as the downtrend from the February and March 2019 highs.
IG Client Sentiment Index: Spot Gold Price Forecast (May 3, 2019) (Chart 2)

Spot gold: Retail trader data shows 75.9% of traders are net-long with the ratio of traders long to short at 3.15 to 1. The number of traders net-long is 0.2% lower than yesterday and 3.3% lower from last week, while the number of traders net-short is 7.2% lower than yesterday and 4.1% lower from last week.
We typically take a contrarian view to crowd sentiment, and the fact traders are net-long suggests spot gold prices may continue to fall. Traders are further net-long than yesterday and last week, and the combination of current sentiment and recent changes gives us a stronger spot gold-bearish contrarian trading bias.
면책 성명:
본 기사의 견해는 저자의 개인적 견해일 뿐이며 본 플랫폼은 투자 권고를 하지 않습니다. 본 플랫폼은 기사 내 정보의 정확성, 완전성, 적시성을 보장하지 않으며, 개인의 기사 내 정보에 의한 손실에 대해 책임을 지지 않습니다.
WikiFX 브로커
최신 뉴스
GO MARKETS(고마켓) 외환 거래 완벽 가이드: 규제, 안전성, 거래 조건 및 플랫폼 특징
 WikiFX
글로벌 에이전트 성장 경험 나누기 이벤트 시작
WikiFX5분만 투자하면 5만원을! WikiFX 외환 거래소 리뷰 이벤트 참여 방법
WikiFX환율 계산기

