简体中文
繁體中文
English
Pусский
日本語
ภาษาไทย
Tiếng Việt
Bahasa Indonesia
Español
हिन्दी
Filippiiniläinen
Français
Deutsch
Português
Türkçe
한국어
العربية
Gold Price Prepares to Breakout as FOMC Rate Decision Nears

요약:Gold continues to bide its time before its next move with price action tempered ahead of next weeks FOMC rate decision when the Fed is fully expected to start cutting interest rates.
FOMC Rate Decision and Gold (XAU) Price, Analysis and Chart
Gold remains constrained but a breakout looms.
FOMC will begin cutting interest rates next Wednesday.
Q3 2019 Gold Forecast and Top Trading Opportunities
Gold Stuck in a Technical Pattern Ahead of the Fed
Gold remains in a narrowing triangular pattern and any breakout will likely wait for next Wednesdays FOMC rate decision where the Fed will embark on a series of interest rate cuts to help boost the economy. A 0.25% rate cut is fully priced-in while expectations of a 0.50% have drifted lower recently to around 17%. While the interest rate cut is priced-in, the post-decision Fed language will be parsed closely to see if the central bank gives any clues to the path of future rate cuts. Next Friday also sees the latest US labor report, another important US dollar shifting event.
The DailyFX Calendar covers all important market moving data releases and events.
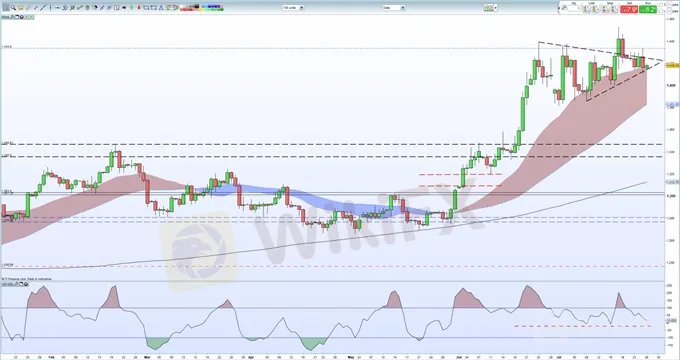
The daily gold chart shows how the price of gold has been constrained this week in a triangular formation and points to a breakout on the horizon. The precious metal has respected the upper and lower trend lines this week and todays price action is muted with gold trading in a narrow $5/oz. range. All three moving averages remain supportive, while the CCI indicator shows that gold has moved out of overbought territory and is nearing its lowest level in nearly two-months. Gold needs to break and close either below or above trend to define the next move. Support remains at $1,400/oz. while to the upside $1433/oz. ahead of $1,439/oz. and then a fresh re-test of the $1,453/oz. six-year high.
Gold Price Daily Chart (January – July 26, 2019)
IG Client Sentiment data show that 72.3% of retail traders are net-long of gold, a bearish contrarian indicator. However, recent daily and weekly positional changes give us a stronger bearish contrarian bias.
면책 성명:
본 기사의 견해는 저자의 개인적 견해일 뿐이며 본 플랫폼은 투자 권고를 하지 않습니다. 본 플랫폼은 기사 내 정보의 정확성, 완전성, 적시성을 보장하지 않으며, 개인의 기사 내 정보에 의한 손실에 대해 책임을 지지 않습니다.
WikiFX 브로커
환율 계산기

