简体中文
繁體中文
English
Pусский
日本語
ภาษาไทย
Tiếng Việt
Bahasa Indonesia
Español
हिन्दी
Filippiiniläinen
Français
Deutsch
Português
Türkçe
한국어
العربية
Fed Fuels Gold & Currency Volatility Shockwave as USD Drops
Resumo:In the aftermath of the Federal Reserve's latest dovish shift in monetary policy, what might spiking implied volatility measures suggest about the next direction in USD and gold prices?
The US Dollar sunk across the board on Thursday following yesterday‘s June Fed meeting which revealed the central bank’s most recent take on monetary policy and economic outlook. Chair Powell and the FOMC communicated a looming pivot in policy from neutral to dovish after stating that the Federal Reserve “will act as appropriate to sustain the expansion.” Together with plunging US treasury yields, the greenback has tumbled lower owing to the updated language that included downward revisions to the Fed dot plot and inflation outlook.
US DOLLAR (DXY) AND CURRENCY VOLATILITY (FXVIX) (INVERSE) – CHART 1: DAILY TIME FRAME (APRIL 18, 2018 TO JUNE 20, 2019)
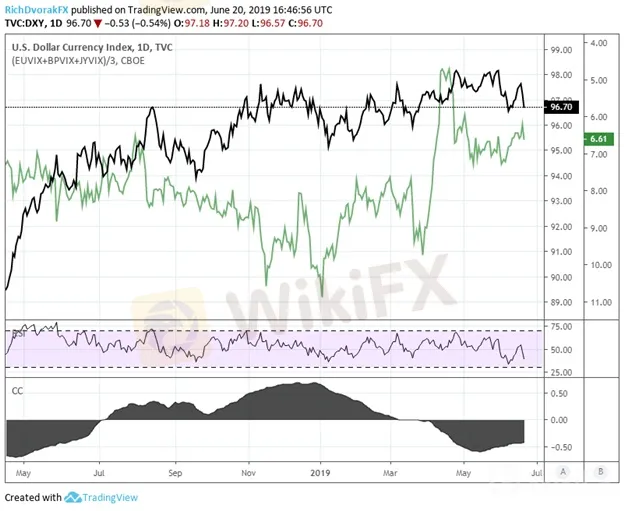
That being said, weakness in the US Dollar threatens to continue. The sharp move to the downside in the DXY US Dollar Index has been matched by a spike in currency volatility – or FXVIX – as measured by an equally weighed index of Cboe‘s 30-day implied volatility readings on the Euro, Pound Sterling, and Japanese Yen. As markets digest the Fed’s capitulation to the lofty interest rate cut expectations currently priced in, traders may see climbing currency volatility exacerbate USD downside which is suggested by the historical relationship and recent negative correlation between USD and FXVIX.
SPOT GOLD (XAUUSD) AND GOLD VOLATILITY (GVZ) – CHART 2: DAILY TIME FRAME (APRIL 18, 2018 TO JUNE 20, 2019)

Unsurprisingly, the topside gold price breakout has mirrored the collapse in interest rates and US Dollar depreciation. With XAUUSD now comfortably above technical resistance aligning with upbeat fundamentals, evidence of additional upside in spot gold appears to be hinted at by the explosion in gold price volatility (GVZ). In fact, XAUUSD just notched its highest close since September 2013 as GVZ skyrocketed to its highest level since April 2017. If US Treasury yields remain under pressure along with the dollar, spot golds advance risks accelerating as bullish sentiment mounts and pushes GVZ higher.
Isenção de responsabilidade:
Os pontos de vista expressos neste artigo representam a opinião pessoal do autor e não constituem conselhos de investimento da plataforma. A plataforma não garante a veracidade, completude ou actualidade da informação contida neste artigo e não é responsável por quaisquer perdas resultantes da utilização ou confiança na informação contida neste artigo.
Corretora WikiFX
Últimas notícias
Dólar Hoje a R$5,53: Tarifas dos EUA e Indicadores Econômicos em Foco
 WikiFX
Ouro a R$ 601.45 (25/07): É a Hora de Comprar?
WikiFXVale a Pena Investir na Trade Nation? Avaliação Forex Completa
WikiFXNeotrades é Fraude? Riscos de Corretoras Não Regulamentadas
WikiFXCálculo da taxa de câmbio

