简体中文
繁體中文
English
Pусский
日本語
ภาษาไทย
Tiếng Việt
Bahasa Indonesia
Español
हिन्दी
Filippiiniläinen
Français
Deutsch
Português
Türkçe
한국어
العربية
Crude Oil Price Outlook Remains Fragile - Will Near-Term Support Hold?
บทคัดย่อ:Crude oils sharp sell-off has halted in the short-term as the market hits support off an important Fibonacci level.
Crude Oil Price Chart and Analysis:
Crude oil hits support – will it hold?
Oil looks heavily oversold in the short-term.
The Brand New DailyFX Q2 2019 Trading Forecast and Guides are Available to Download Now!!
How to Trade Oil: Crude Oil Trading Strategies & Tips.
Crude Oil Slump
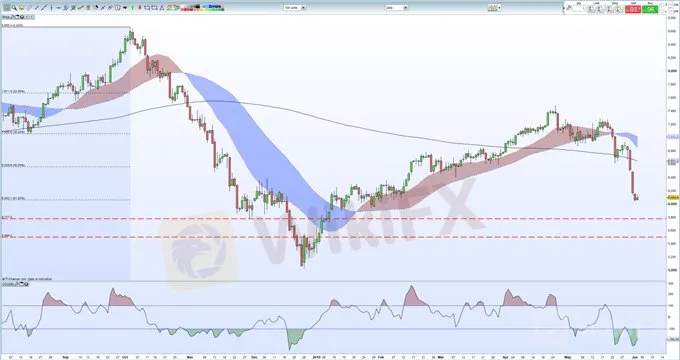
The price of a barrel of crude oil fell by over 12% last week as trade fears heightened, undermining global growth concerns. Oil also fell through noted support levels, including the 200-day moving average, which accelerated the move lower and took oil to a five-month low. We warned two-weeks ago that chart support looked weak with the 50% Fibonacci retracement level breached in subsequent days.
Oil has now bounced off the 61.8% Fibonacci retracement level and this may hold in the short-term, unless trade war rhetoric increases. The crude oil chart is also flashing an extreme oversold signal with the CCI indicator at once stage hitting -250, a level not seen since mid-December last year when the price of oil touched $50.0/bbl.
Support on the chart is seen at $60.63/bbl. – the previously mentioned Fibonacci retracement level –ahead of a cluster of highs/lows around the $59/bbl. area. Crude oil will need to consolidate around current levels, or higher, to start rebuilding some confidence in the market, which has fallen nearly 20% in less than six weeks. To the upside, the gap created on last Fridays (May 31) candle between $61.6/bbl. and $64.9/bbl. will be the bulls first target.
Crude Oil Price Collapses Through Key Supports: More to Go?
WTI vs Brent: Top 5 Differences Between WTI and Brent Crude Oil
Crude Oil Daily Price Chart (August 2018 – June 3, 2019)
Traders may be interested in two of our trading guides – Traits of Successful Traders and Top Trading Lessons – while technical analysts are likely to be interested in our latest Elliott Wave Guide.
ข้อจำกัดความรับผิดชอบ:
มุมมองในบทความนี้แสดงถึงมุมมองส่วนตัวของผู้เขียนเท่านั้นและไม่ถือเป็นคำแนะนำในการลงทุน สำหรับแพลตฟอร์มนี้ไม่รับประกันความถูกต้องครบถ้วนและทันเวลาของข้อมูลบทความ และไม่รับผิดชอบต่อการสูญเสียใด ๆ ที่เกิดจากการใช้ข้อมูลในบทความ
WikiFX โบรกเกอร์
ข่าวล่าสุด
รวมรีวิวโบรกเกอร์ประจำสัปดาห์ โบรกเกอร์ไหนดี โพสต์นี้มีคำตอบ !
 WikiFX
ประเภทของกลโกงในวงการ Forex
WikiFXก.ล.ต. เห็นชอบ ปรับปรุงเกณฑ์ให้สามารถซื้อขาย Tokenized Carbon Credit ผ่านศูนย์ซื้อขาย นายหน้า
WikiFXบทสัมภาษณ์ผู้เชี่ยวชาญระดับโลกของ WikiEXPO: JinDao Tai ——อนาคตของการซื้อขาย Forex
WikiFXดอลล์แข็งค่า รับข้อมูลศก.สดใส-ตลาดคลายกังวลสงครามการค้า
WikiFXทองปิดบวก $10.30 วิตกสงครามการค้าหนุนแรงซื้อสินทรัพย์ปลอดภัย
WikiFXข้อมูลสินค้าคงคลังสหรัฐหนุนราคาน้ำมัน แต่ข้อตกลงการหยุดยิงยังจำกัดกำไร
WikiFXทำไมพอร์ตการลงทุนที่ดีต้องมีทองคำ
WikiFXประกาศ WikiFX: การระงับการแข่งขันการซื้อขายจำลองรายสัปดาห์
WikiFXเทคนิควางแผนการเงิน ฉบับพนักงานออฟฟิศ
WikiFXคำนวณอัตราแลกเปลี่ยน

