简体中文
繁體中文
English
Pусский
日本語
ภาษาไทย
Tiếng Việt
Bahasa Indonesia
Español
हिन्दी
Filippiiniläinen
Français
Deutsch
Português
Türkçe
한국어
العربية
Crude Oil Prices Up, Gold Down as Markets Cheer US-Mexico Detente
บทคัดย่อ:Crude oil prices rose with stocks while gold prices fell as the US Dollar rose with bond yields after the White House shelved a plan to impose tariffs on Mexico.
CRUDE OIL & GOLD TALKING POINTS:
Crude oil prices rose with stocks as US shelved Mexico import tariffs
Gold prices down as bond yields, US Dollar advance in risk-on trade
Sentiment likely to remain in focus, stock index futures point upward
Sentiment-linked crude oil prices gapped higher alongside bellwether S&P 500 futures at the start of the trading week as news that the US has shelved a plan to impose tariffs on imports from Mexico buoyed overall risk appetite. Gold prices fell the upbeat mood cooled Fed rate cut speculation, sending the US Dollar higher alongside bond yields and undercutting the appeal of non-interest-bearing and anti-fiat assets.
CRUDE OIL MAY CONTINUE HIGHER AS GOLD FALLS IN RISK-ON TRADE
Looking ahead, a relatively muted offering on the economic data docket might broad-based trends in the markets mood in focus. Futures tracking Wall Street stock benchmark are pointing convincingly higher, hinting that the risk-on tilt may extend from Asia Pacific trade into European and US hours. That might bode ill for gold as crude oil continues to recover.
Did we get it right with our crude oil and gold forecasts? Get them here to find out!
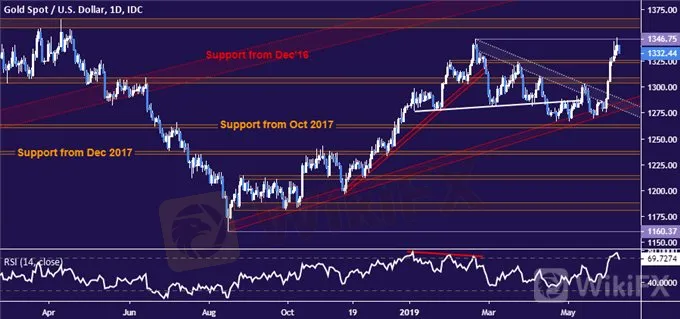
GOLD TECHNICAL ANALYSIS
Gold prices are pulling back from resistance marked by Februarys swing high at 1346.75. A turn back below resistance-turned-support at 1323.40 sets the stage for a retest of the 1303.70-09.12 zone. Alternatively, a daily close above resistance targetsa trend-defining barrier in the 1357.50-66.06 area.
CRUDE OIL TECHNICAL ANALYSIS
Crude oil prices rose after forming a Bullish Engulfing candlestick pattern at support in the 50.31-51.33 area, as expected. From here, a daily close above support-turned-resistance at 55.75 targets the 57.24-88 zone next. Alternatively, a reversal below 50.31 opens the door to challenge support set from September 2016 in the 42.05-43.00 region.

ข้อจำกัดความรับผิดชอบ:
มุมมองในบทความนี้แสดงถึงมุมมองส่วนตัวของผู้เขียนเท่านั้นและไม่ถือเป็นคำแนะนำในการลงทุน สำหรับแพลตฟอร์มนี้ไม่รับประกันความถูกต้องครบถ้วนและทันเวลาของข้อมูลบทความ และไม่รับผิดชอบต่อการสูญเสียใด ๆ ที่เกิดจากการใช้ข้อมูลในบทความ
WikiFX โบรกเกอร์
FOREX.com
Neex
Vantage
Pepperstone
XM
EC Markets
FOREX.com
Neex
Vantage
Pepperstone
XM
EC Markets
WikiFX โบรกเกอร์
FOREX.com
Neex
Vantage
Pepperstone
XM
EC Markets
FOREX.com
Neex
Vantage
Pepperstone
XM
EC Markets
ข่าวล่าสุด
รวมรีวิวโบรกเกอร์ประจำสัปดาห์ โบรกเกอร์ไหนดี โพสต์นี้มีคำตอบ !
 WikiFX
ประเภทของกลโกงในวงการ Forex
WikiFXก.ล.ต. เห็นชอบ ปรับปรุงเกณฑ์ให้สามารถซื้อขาย Tokenized Carbon Credit ผ่านศูนย์ซื้อขาย นายหน้า
WikiFXบทสัมภาษณ์ผู้เชี่ยวชาญระดับโลกของ WikiEXPO: JinDao Tai ——อนาคตของการซื้อขาย Forex
WikiFXดอลล์แข็งค่า รับข้อมูลศก.สดใส-ตลาดคลายกังวลสงครามการค้า
WikiFXข้อมูลสินค้าคงคลังสหรัฐหนุนราคาน้ำมัน แต่ข้อตกลงการหยุดยิงยังจำกัดกำไร
WikiFXทองปิดบวก $10.30 วิตกสงครามการค้าหนุนแรงซื้อสินทรัพย์ปลอดภัย
WikiFXทำไมพอร์ตการลงทุนที่ดีต้องมีทองคำ
WikiFXประกาศ WikiFX: การระงับการแข่งขันการซื้อขายจำลองรายสัปดาห์
WikiFXเทคนิควางแผนการเงิน ฉบับพนักงานออฟฟิศ
WikiFXคำนวณอัตราแลกเปลี่ยน

