简体中文
繁體中文
English
Pусский
日本語
ภาษาไทย
Tiếng Việt
Bahasa Indonesia
Español
हिन्दी
Filippiiniläinen
Français
Deutsch
Português
Türkçe
한국어
العربية
Crude Oil, Gold Prices Look to Fed Rate Decision for Direction Cues
บทคัดย่อ:Crude oil and gold prices are looking ahead to the Federal Reserve policy announcement for direction cues. The balance of risks seems to bode ill for commodities.
CRUDE OIL & GOLD TALKING POINTS:
Crude oil prices idle in familiar range, API inventory data due
Gold prices continue to show signs of an emerging double top
Commodities waiting for FOMC before committing to direction
Commodity prices idled at the start of the trading week, as expected. The standstill probably reflects investors unwillingness to commit ahead of potent event risk in the coming days. Needless to say, the FOMC monetary policy announcement stands out on that front.
The US central bank will update its official rate path outlook, which markets expect will bring a substantial dovish revision. If that proves accurate, swelling risk appetite might lift crude oil prices while the US Dollar weakens alongside bond yields, lifting gold.
Investors already price in 2-3 rate cuts this year along with the end of the Feds quantitative tightening (QT) balance sheet reduction effort, however. That would mark an improbably dramatic about-face for policymakers. That means a relatively hawkish surprise seems like a greater risk than the alternative.
Looking ahead, a barebones offering on the economic calendar and inconclusive cues from bellwether S&P 500 futures – a baseline for prevailing sentiment trends – hint at another inconclusive session. API inventory flow data is on tap and will be weighed against bets on 1.77-million-barrel drawdown.
Did we get it right with our crude oil and gold forecasts? Get them here to find out!
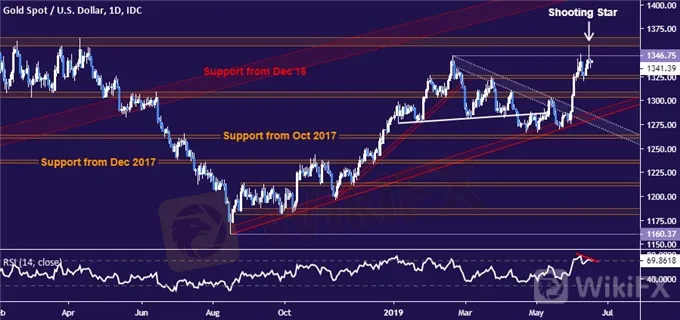
GOLD TECHNICAL ANALYSIS
The appearance of a Shooting Star candlestick coupled with negative RSI divergence hints at a double top taking shape on a test of resistance marked by Februarys swing highat 1346.75.Breaking below initial support in the 1323.40-26.30 area exposes the 1303.70-09.12 zone. Alternatively, a move back above 1346.75 opens the door to test the 1357.50-66.06 regionnext.
CRUDE OIL TECHNICAL ANALYSIS
Crude oil prices continue to tread water at support in the 50.31-51.33 area. A daily close below it sets the stage to challenge a floor set from September 2016 in the 42.05-43.00 zone. Alternatively, a turn back above the upper layer of near-term resistance at 55.75 targets the 57.24-88 region next.

COMMODITY TRADING RESOURCES
See our guide to learn about the long-term forces driving crude oil prices
Having trouble with your strategy? Heres the #1 mistake that traders make
Join a free webinar and have your commodity market questions answered
ข้อจำกัดความรับผิดชอบ:
มุมมองในบทความนี้แสดงถึงมุมมองส่วนตัวของผู้เขียนเท่านั้นและไม่ถือเป็นคำแนะนำในการลงทุน สำหรับแพลตฟอร์มนี้ไม่รับประกันความถูกต้องครบถ้วนและทันเวลาของข้อมูลบทความ และไม่รับผิดชอบต่อการสูญเสียใด ๆ ที่เกิดจากการใช้ข้อมูลในบทความ
WikiFX โบรกเกอร์
EC Markets
IC Markets Global
STARTRADER
FOREX.com
FBS
FXTM
EC Markets
IC Markets Global
STARTRADER
FOREX.com
FBS
FXTM
WikiFX โบรกเกอร์
EC Markets
IC Markets Global
STARTRADER
FOREX.com
FBS
FXTM
EC Markets
IC Markets Global
STARTRADER
FOREX.com
FBS
FXTM
ข่าวล่าสุด
มือใหม่ 90% ไม่เคยรู้! MT4 กับ MT5 ต่างกันตรงไหน ระวังเทรดพังเพราะเลือกผิด
 WikiFX
รีวิว ThinkMarkets ใช้แล้วเป็นยังไง? สำนักงานดูดีแล้วเทรดลื่นหรือเปล่า
WikiFXเชื่อหรือไม่!? เทรดเดอร์คนแรกของโลกอาจเป็นชาวบาบิโลน
WikiFXเทรดยังไงก็ไม่รอด...เพราะคุณไม่เคยฝึกจิตใจของตัวเอง
WikiFXรีวิว FXView ถ้าเคยใช้ช่วยบอกหน่อย ดีจริงอย่างที่เขาว่าหรือแค่การโฆษณา
WikiFXกราฟเหวี่ยงเพราะอะไร? คำตอบอยู่ใน “ปฏิทินข่าว Forex”
WikiFXรีวิว Headway ถอนเงินยากจริงหรือเปล่า ใครเคยใข้รีบบอกด่วน!
WikiFXรีวิว Amega ไม่มีสำนักงานแต่มีปัญหาบ่อย ใครเคยโดนรีวิวหน่อย
WikiFXคำนวณอัตราแลกเปลี่ยน

