简体中文
繁體中文
English
Pусский
日本語
ภาษาไทย
Tiếng Việt
Bahasa Indonesia
Español
हिन्दी
Filippiiniläinen
Français
Deutsch
Português
Türkçe
한국어
العربية
Crude Oil Prices at Risk if US Economic Data Cool Fed Rate Cut Bets
บทคัดย่อ:Crude oil prices may fall if upbeat US retail sales and consumer confidence data cool Fed rate cut bets and sour risk appetite across financial markets.
CRUDE OIL & GOLD TALKING POINTS:
Crude oil prices fall as OPEC+ dithers on output reduction
Gold prices seesaw on ECB rate decision, US inflation data
Firm US retail, confidence data may cool Fed rate cut bets
Crude oil prices fell as OPEC+ energy ministers – a steering group for the cartel-led coordinated output cut effort among major suppliers – dithered on reducing production further. The newly-minted representative from Saudi Arabia said any such decision will have to wait until December.
Meanwhile, gold prices seesawed. The metal initially rushed higher as the ECB announced another round of quantitative easing, then promptly reversed course as headline US CPI registered lower than expected. That seemed to boost confidence in potent Fed easing at next weeks FOMC meeting, buoying risk appetite.
CRUDE OIL PRICES AT RISK IF US ECONOMIC DATA DENTS FED RATE CUT BETS
Looking ahead, US retail sales and consumer confidence data are in focus. Outcomes echoing the recent tendency for US economic news-flow to top baseline forecasts might cool Fed rate cut speculation. That is likely to dent risk appetite, weighing on oil prices.
Gold prices might have been expected to track higher in a risk-off environment as capital flowing toward the safety of government debt drive down bond yields. That may be a difficult feat to muster however when worries about higher-than-expected borrowing costs are the source of turmoil themselves.
Get our free guide to help build confidence in your gold and crude oil trading strategy!
GOLD TECHNICAL ANALYSIS
Gold prices continue to hover above support near the August swing bottom in the 1480.00-84.63 area. A daily close below that exposes the 1437.70-52.95 area next. Alternatively, a push above the 1520.34-23.05 price inflection area sets the stage for rise to challenge the weekly chart inflection point at 1563.00.
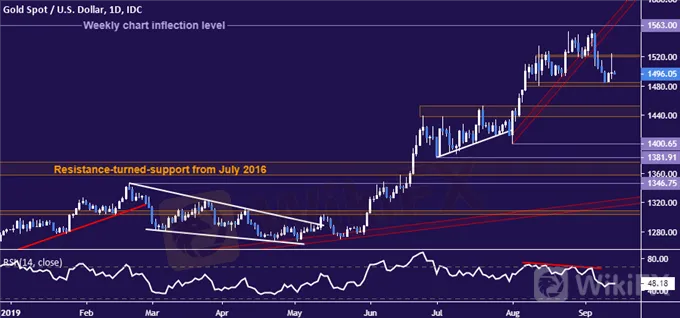
Gold price chart created using TradingView
CRUDE OIL TECHNICAL ANALYSIS
Crude oil prices continue to hover above support guiding the upswing from Augusts swing bottom. A daily close below this level – now at 55.11 – faces a minor barrier at 52.96 along the way to challenge major support near the $50/bbl figure. Alternatively, a bounce that clears the September 10 high at 58.76 sets the stage for a test of the 60.04-84 area.

Crude oil price chart created using TradingView
COMMODITY TRADING RESOURCES
See our guide to learn about the long-term forces driving crude oil prices
Having trouble with your strategy? Heres the #1 mistake that traders make
Join a free webinar and have your commodity market questions answered
ข้อจำกัดความรับผิดชอบ:
มุมมองในบทความนี้แสดงถึงมุมมองส่วนตัวของผู้เขียนเท่านั้นและไม่ถือเป็นคำแนะนำในการลงทุน สำหรับแพลตฟอร์มนี้ไม่รับประกันความถูกต้องครบถ้วนและทันเวลาของข้อมูลบทความ และไม่รับผิดชอบต่อการสูญเสียใด ๆ ที่เกิดจากการใช้ข้อมูลในบทความ
WikiFX โบรกเกอร์
IC Markets Global
HFM
Neex
FXCM
ATFX
IB
IC Markets Global
HFM
Neex
FXCM
ATFX
IB
WikiFX โบรกเกอร์
IC Markets Global
HFM
Neex
FXCM
ATFX
IB
IC Markets Global
HFM
Neex
FXCM
ATFX
IB
ข่าวล่าสุด
รวมรีวิวโบรกเกอร์ประจำสัปดาห์ โบรกเกอร์ไหนดี โพสต์นี้มีคำตอบ !
 WikiFX
ประเภทของกลโกงในวงการ Forex
WikiFXก.ล.ต. เห็นชอบ ปรับปรุงเกณฑ์ให้สามารถซื้อขาย Tokenized Carbon Credit ผ่านศูนย์ซื้อขาย นายหน้า
WikiFXบทสัมภาษณ์ผู้เชี่ยวชาญระดับโลกของ WikiEXPO: JinDao Tai ——อนาคตของการซื้อขาย Forex
WikiFXดอลล์แข็งค่า รับข้อมูลศก.สดใส-ตลาดคลายกังวลสงครามการค้า
WikiFXทองปิดบวก $10.30 วิตกสงครามการค้าหนุนแรงซื้อสินทรัพย์ปลอดภัย
WikiFXข้อมูลสินค้าคงคลังสหรัฐหนุนราคาน้ำมัน แต่ข้อตกลงการหยุดยิงยังจำกัดกำไร
WikiFXทำไมพอร์ตการลงทุนที่ดีต้องมีทองคำ
WikiFXประกาศ WikiFX: การระงับการแข่งขันการซื้อขายจำลองรายสัปดาห์
WikiFXเทคนิควางแผนการเงิน ฉบับพนักงานออฟฟิศ
WikiFXคำนวณอัตราแลกเปลี่ยน

