简体中文
繁體中文
English
Pусский
日本語
ภาษาไทย
Tiếng Việt
Bahasa Indonesia
Español
हिन्दी
Filippiiniläinen
Français
Deutsch
Português
Türkçe
한국어
العربية
Spot Gold Price Chart Reveals Plunge Towards Support as USD Rips Higher
Özet:Spot gold is coming under pressure today, likely in response to a surging US Dollar following less-dovish remarks from Fed officials revealed in the latest FOMC minutes. Which key XAUUSD technical levels might be targeted next?
Gold is sinking today with spot prices trading roughly 1 percent lower and could put the medium-term bullish uptrend at risk if the precious metal falls further. Month-to-date spot gold performance remains in positive territory, however, despite todays drop pushing gold below psychological support at the $1,300 level.
SPOT GOLD PRICE CHART: DAILY TIME FRAME (OCTOBER 31, 2018 TO APRIL 11, 2019)
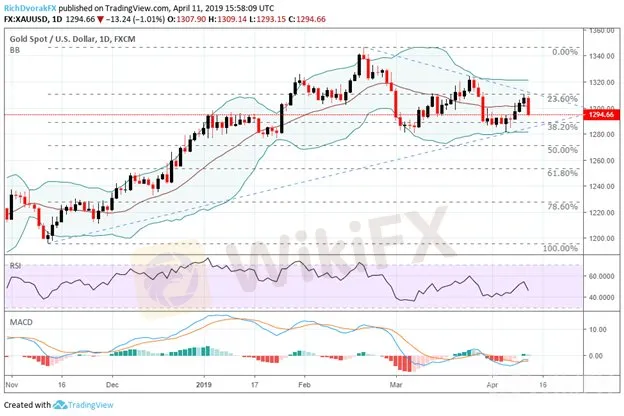
Spot gold enjoyed a healthy rebound higher earlier this month after prices based at the 38.2 percent Fibonacci retracement line drawn from the low recorded in November 2018 and top printed in February 2019. Although, the short-lived advance was halted once XAUUSD approached $1,310 yesterday where the 23.6 percent Fib and recent downtrend line rejected further upside. Less-dovish Fed language revealed in the March FOMC minutes could be contributing to the selling pressure in gold considering a surging US Dollar and rebounding interest rates make gold less attractive.
Now, XAUUSD is re-approaching technical support near the $1,285 price where prices have formed a strong area of confluence. Long-term uptrend support formed by the lows in November 2018 and earlier this month has potential to bolster gold prices while the 38.2 percent Fib looks to provide support once again. Nevertheless, a break below the rising trendline would likely threatens golds longer-term uptrend while a move above the falling trendline could reassert a bullish bias.
SPOT GOLD TRADER SENTIMENT PRICE CHART: DAILY TIME FRAME (OCTOBER 15, 2018 TO APRIL 11, 2019)

Check out IGs Client Sentiment here for more detail on the bullish and bearish biases of EURUSD, GBPUSD, USDJPY, Gold, Bitcoin and S&P500.
According to client positioning data from IG, 74.6 percent of spot gold traders are net-long with the ratio of traders long to short at 2.93 to 1. Although, the number of traders net-long is 8.7 percent lower than yesterday and 6.5 percent lower than last week.
Feragatname:
Bu makaledeki görüşler yalnızca yazarın kişisel görüşlerini temsil eder ve bu platform için yatırım tavsiyesi teşkil etmez. Bu platform, makale bilgilerinin doğruluğunu, eksiksizliğini ve güncelliğini garanti etmez ve makale bilgilerinin kullanılması veya bunlara güvenilmesinden kaynaklanan herhangi bir kayıptan sorumlu değildir.
WikiFX Broker
Son Haberler
Tesla'da dönüm noktası: Batacak mı, çıkacak mı?
 WikiFX
Güvenli liman talebi zayıfladı: Altın haftayı düşüşle kapatıyor
WikiFXSon dakika... Merkez Bankası faiz kararını açıkladı
WikiFXBakanlıktan ÖTV açıklaması: Cari açığın azaltılmasına katkı sağlayacak
WikiFX10 soruda "Gayrimenkul Sertifikası" ile borsadan ev alma süreci
WikiFXTemmuzda hizmet ve perakendede güven geriledi, inşaatta arttı
WikiFXFaiz indirimi sonrası mevduat oranları geri çekildi: 1 milyon TL'nin getirisi ne kadar?
WikiFXKuru meyve ihracatında artış: Kuru üzüm zirvede
WikiFXFitch Türkiye'nin kredi notunu teyit etti
WikiFXKKM bakiyelerindeki düşüş devam ediyor
WikiFXKur Hesaplayıcı

