简体中文
繁體中文
English
Pусский
日本語
ภาษาไทย
Tiếng Việt
Bahasa Indonesia
Español
हिन्दी
Filippiiniläinen
Français
Deutsch
Português
Türkçe
한국어
العربية
Recession Fears Hit Stocks, Boost US Treasuries, Other Safe Havens
Lời nói đầu:Concern that the ongoing US-China trade dispute is hitting economic growth worldwide is damaging risk appetite, boosting safe havens such as US Treasuries at the expense of stocks and oil.
Risk aversion grips markets:
Fears of a global recession are lifting the prices of safe havens such as US Treasuries and reigniting talk of another US rate cut by the Federal Reserve.
As risk aversion grips the markets, the key question is whether optimism will return or traders will continue to shun stocks and other assets seen as risky.
Stocks and Oil Prices Fall as Demand Rises for US Treasuries
A move away from stocks and other risky assets is strengthening as traders worry that the US-China trade war is already hitting global growth and could lead eventually to a worldwide recession. That is hitting oil prices too, as concerns grow that an economic slowdown could reduce demand.
As a result, haven assets such as US Treasuries and German Bunds are attracting buyers, while talk is spreading that the Federal Reserve could cut US interest rates to boost its economy.
In the Treasury market, the yield curve has again inverted – regarded by some as an early signal of recession – with the yield on three-year debt above the yield on 10-year notes, which has hit its lowest since September 2017.
US Treasury Yield Curve (May 29, 2019)
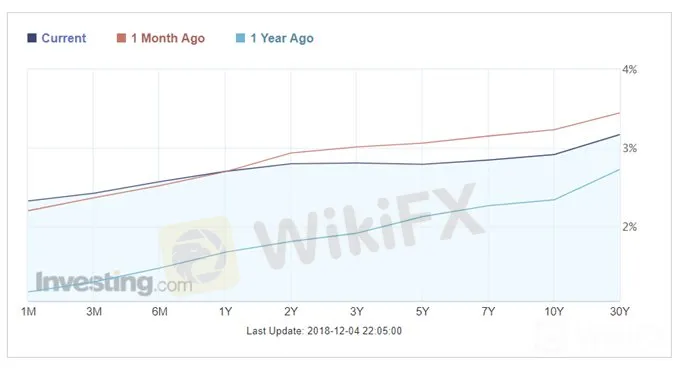
Source: Investing.com
Why Does the US Yield Curve Inversion Matter?
Against this background, talk of another rate cut by the US Federal Reserve is spreading, with the CME FedWatch Tool suggesting that a quarter-point reduction is more likely by the Feds meeting on September 18 than an unchanged 2.25%-2.50%.
US Target Rate Probabilities for September 18, 2019 Fed meeting

Source: CME
By contrast, stock markets are weakening, with the FTSE 100 in London, the DAXin Frankfurt and the CAC 40 in Paris all down by between 1.0% and 1.50% by mid-morning Wednesday in Europe. The US crude oil price is sliding too on concern that demand will dry up even if output is cut by the major producers.
Will the Stock Markets Crash in 2019?
US Crude Oil Price Chart, 15-Minute Timeframe (May 28-29, 2019)

Chart by IG (You can click on it for a larger image)
This latest bout of risk aversion follows local newspaper reports that China could restrict its sales to the US of “rare earths” – a group of 17 minerals used in sectors such as renewable energy, oil refining, electronics and the glass industry. In addition, Chinese technology company Huawei has filed a lawsuit against the US Government in an attempt to reverse sanctions on it, while the fallout from the European Parliament elections is spreading in countries such as Italy, Greece and Austria.
Whether this move into safe havens will persist is an open question but for now it seems likely that more funds will flow not just into Treasuries and Bunds but also into haven currencies like the Japanese Yen, which continues to climb against the riskier British Pound and Euro.
EURJPY Price Chart, Two-Hour Timeframe (April 11 – May 29, 2019)

Chart by IG (You can click on it for a larger image)
A Guide to Safe-Haven Currencies and How to Trade Them
Note though that gold is failing to benefit despite its traditional role as a bolt-hole when market sentiment turns sour.
Gold Price Chart, One-Hour Timeframe (May 14-29, 2019)

Chart by IG (You can click on it for a larger image)
Miễn trừ trách nhiệm:
Các ý kiến trong bài viết này chỉ thể hiện quan điểm cá nhân của tác giả và không phải lời khuyên đầu tư. Thông tin trong bài viết mang tính tham khảo và không đảm bảo tính chính xác tuyệt đối. Nền tảng không chịu trách nhiệm cho bất kỳ quyết định đầu tư nào được đưa ra dựa trên nội dung này.
Sàn môi giới
IC Markets Global
FXTM
STARTRADER
Saxo
EC Markets
TMGM
IC Markets Global
FXTM
STARTRADER
Saxo
EC Markets
TMGM
Sàn môi giới
IC Markets Global
FXTM
STARTRADER
Saxo
EC Markets
TMGM
IC Markets Global
FXTM
STARTRADER
Saxo
EC Markets
TMGM
Tin HOT
Khám phá các phương pháp giao dịch Forex đơn giản nhất 2025
 WikiFX
Cảnh báo về vụ việc TikToker nổi tiếng Happi.mommi lừa đảo: Bối cảnh và thủ đoạn
WikiFXThị trường Forex Việt Nam: Sàn môi giới nào tốt nhất tháng 03/2025?
WikiFXMyForexFunds và 5 dấu hiệu nhận biết một quỹ đầu tư Forex nghi vấn
WikiFXWikiEXPO Hong Kong 2025 – Xây dựng niềm tin, vươn tới tầm cao mới
WikiFXPi Network hôm nay và nỗi đau của nhiều nhà đầu tư
WikiFXGiá Pi Network hôm nay lại giảm khi xuất hiện nhiều dự án đào coin tương tự
WikiFXHơn 3 triệu người Việt sẽ thành tỷ phú nhờ Pi Network?
WikiFXThông báo từ WikiFX: Tạm dừng cuộc thi Giao dịch Demo Hàng tuần
WikiFXTính tỷ giá hối đoái

