简体中文
繁體中文
English
Pусский
日本語
ภาษาไทย
Tiếng Việt
Bahasa Indonesia
Español
हिन्दी
Filippiiniläinen
Français
Deutsch
Português
Türkçe
한국어
العربية
USDJPY Price: Tight Trading Range Ahead of US NFPs
摘要:USDJPY volatility remains low ahead of the latest US Labor report but pivot point analysis shows areas of support and resistance inside the current tight
USDJPY Price, Chart and Analysis:
USDJPY has traded in a 56 pip range this week as traders wait for inspiration.
Retail remain net-short, a bullish contrarian set-up.
Q1 2019 Japanese Yen Analysis and Forecast.
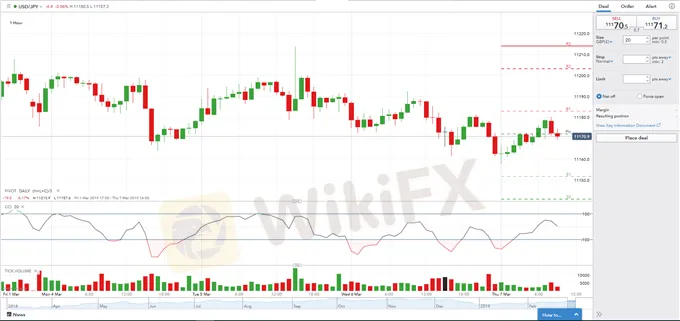
Low volatility – tight trading conditions – is currently a common denominator of most major fx-pairs and USDJPY is no exception. The pair have been stuck in a 56 pip range this week (111.58 – 112.14) making trading difficult. Looking inside this range, pivot points show pivot currently at 111.72 with initial resistance (R1) at 111.83 and first support (S1) at 111.52. The Commodity Channel Index (CCI) is trading in the middle of the -100/+100 range and currently gives no guidance.
Traders are now pinning their hopes on Friday‘s US Non-Farm Payrolls figure to help break this current impasse. Market expectations are currently for +185k new jobs – after last month’s blockbuster +305k - and a 0.3% rise in average hourly earnings (m/m).
USDJPY One-Hour Price Chart (March 1 – March 7, 2019)
IG Client Sentiment data show that retail traders remain net-short of USDJPY, a bullish contrarian set-up, with retail increasing their short-positions by 18.6% over the last week, increasing this bullish bias.

Traders may be interested in two of our trading guides – Traits of Successful Traders and Top Trading Lessons – while technical analysts are likely to be interested in our latest Elliott Wave Guide.
What is your view on the USDJPY – bullish or bearish? You can let us know via the form at the end of this piece or you can contact the author at nicholas.cawley@ig.comor via Twitter @nickcawley1.
免责声明:
本文观点仅代表作者个人观点,不构成本平台的投资建议,本平台不对文章信息准确性、完整性和及时性作出任何保证,亦不对因使用或信赖文章信息引发的任何损失承担责任
天眼交易商
热点资讯
澳洲ASIC的AR牌照亦真亦假 用户可能面临投诉无门
 WikiFX
外汇天眼4月客诉榜:这些汇市收割机正在切开你的钱包!
WikiFX我们正在经历新一轮“淘金热”吗?为什么大家又开始关注黄金!
WikiFX大马股市遭骇客入侵,投资者交易户头被滥用引发安全担忧
WikiFX交易的本质:一场关于风险、时机与人性的游戏
WikiFX外汇交易与加密货币交易全面对比:如何选择更适合你的投资方式?
WikiFX【警惕】慈善名人遭冒用!七旬翁险被骗万元养老金,诈骗手法曝光
WikiFX7.99分的Dupoin与暴雷的KVB PRIME 背后竟然是原班人马
WikiFX警惕高回报诱惑!工厂职员在Telegram投资骗局中损失RM130,000
WikiFX汇率计算

