S&P 500 Outlook: Unemployment Data, Utilities To Lead Index Price
摘要:The S&P 500 will look to Fridays release of non-farm payrolls data as it struggles to fend off bearish price action.
S&P 500 Outlook Talking Points:
Another round of TLTROs from the ECB seemingly pressured the S&P 500 on Thursday, contributing to a fourth consecutive day of losse
Non-farm payrolls and US unemployment will be released at 13:30 GMT, 8:30 AM EST Friday
The data may leverage significant influence over US equities given their turbulence this week
See how IG clients are positioned on the Dow Jones, S&P 500 and the US Dollar with our free IG Client Sentiment Data.
S&P 500 Outlook: Unemployment Data to Lead Index Price
Yesterday I highlighted the potential impact of the ECB‘s monetary policy meeting on the Dow Jones. With the resulting price action more bearish than anticipated, a risk-off mood remains dominant into Friday’s session. As the headline data, change in US non-farm payrolls and the unemployment rate will look to influence early equity performance as markets digest the data.
US Unemployment Rate (Chart 1)
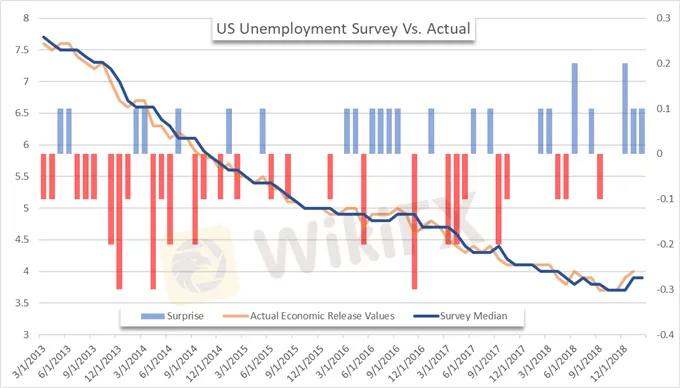
With previous unemployment releases, sector sensitivity to data surprises seems to be somewhat random and often overshadowed by other themes. For example, the unemployment rate in December 2018 surprised markets with a 0.2% beat of survey expectations. Evidently, strong employment was unable to stem the tide from other market themes and sector performance was negative throughout. The recent string of positive data surprises also did little to encourage bullish price action.
S&P 500 Sector Reaction to Unemployment Data (Chart 2)

With that said, the utilities sector appears to be one of the more volatile industries on days of the data‘s release. Regardless of direction, the sector has been one of the top-3 biggest movers in 6 of the last 8 release sessions. Further, it notched the biggest move in 4 of the last 8. As Friday’s session approaches, it would be within reason to assume utilities will once again appear an outlier for market volatility.
Dow Jones Price Chart: Daily Time Frame (January 2018 – March 2019) (Chart 3)

Dow Jones Price chart overlaid with ratio of SPX to XLU (Utilities ETF)
The sector has outperformed the broader S&P 500 since mid-February. Largely because the typically-defensive sector has enjoyed gains from the broader-market rebound while standing firm on red days like today.
Looking to take your trading to the next level? Check out our free Advanced Trading Guides.
According to a Twitter poll, traders are fairly split on tomorrow‘s unemployment outcome, with a slight bearish leaning. Follow @PeterHanksFX to participate in the poll and for equity-leaning content. Given the turbulence in equities this week after failing to break through technical resistance, tomorrow’s data may spark considerable price action as traders grasp to find the next trend.
For other non-farm payroll trading opportunities, check out Pre-NFP Price Action Setups Across the US Dollar.Non-farm payrolls is one of the most market moving economic indicator for the US Dollar, learn to trade real-time news events like it with our Trade the News Trading Guide.
免责声明:
本文观点仅代表作者个人观点,不构成本平台的投资建议,本平台不对文章信息准确性、完整性和及时性作出任何保证,亦不对因使用或信赖文章信息引发的任何损失承担责任
天眼交易商
热点资讯
重磅官宣!EC Markets 成为英超冠军球队利物浦全球官方合作伙伴
 WikiFX
出金8次、等了两个月均杳无音讯 离岸监管有什么问题?
WikiFX外汇投资骗局卷土重来:跨国团伙以合法平台为幌,骗走大马逾590万令吉
WikiFX“高回酬”投资骗局再现网络平台 马来西亚男子痛失逾26万令吉
WikiFX炒外汇却被当猴耍 为啥这个国家的平台专门收割中国人?
WikiFX汇率计算

