简体中文
繁體中文
English
Pусский
日本語
ภาษาไทย
Tiếng Việt
Bahasa Indonesia
Español
हिन्दी
Filippiiniläinen
Français
Deutsch
Português
Türkçe
한국어
العربية
Sterling Weekly Price Outlook: British Pound Rejected at Resistance
概要:Sterling is down nearly 2% after reversing from seven-month highs last week. Here are the targets and invalidation levels that matter on the GBP/USD weekly
Updated weekly technicals on the British Pound (GBP/USD) – Price reversal risks further losse
Check out our 2019 projections in our Free DailyFX GBP/USD Trading Forecast
Join Michael for Live Weekly Strategy Webinars on Mondays at 12:30GMT
In this series we scale-back and look at the broader technical picture to gain a bit more perspective on where we are in trend. The British Pound is down nearly 2% from the late-February highs against the US Dollarwith Sterling on pace to post a fifth consecutive daily decline today in New York. The losses come on the back of last weeks reversal from technical resistance and leaves the Pound vulnerable to further losses near-term. These are the updated targets and invalidation levels that matter on the GBP/USD weekly chart.
New to Forex Trading? Get started with this Free Beginners Guide
GBP/USD Weekly Price Chart
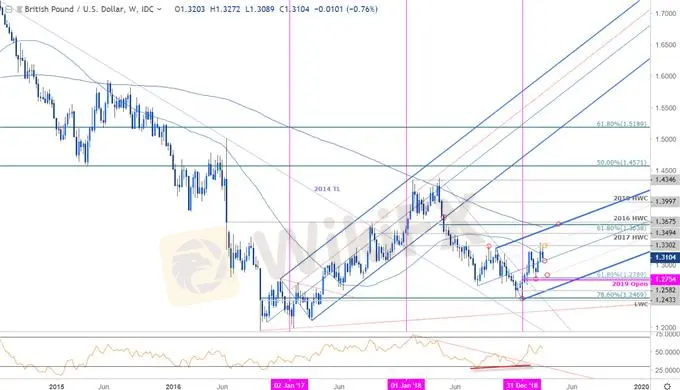
Notes: In last months GBP/USD Weekly Technical Outlook we noted that Sterling was approaching a, “critical support confluence at 1.2738/54 – a region defined by the 2019 open & the 61.8% retracement of the yearly range and converges on the 25%-line of the ascending pitchfork formation extending off the August / January lows. IF price is going to make a near-term recovery, this would be a good spot to watch.”We added that a breach above resistance at 1.3205 was, “needed to mark resumption of the January breakout. Such a scenario would have us targeting subsequent resistance objectives at the December 2017 low at 1.33.”
Price registered a low at 1.2773 before reversing sharply with the advance failing last week after probing through confluence resistance at the 1.33-handle. Note that weekly momentum divergence into the most recent high highlights the risk for a move lower here within the broader uptrend. Look for initial support along the median-line, currently ~1.3050s backed by the 25% line around ~1.2830s – an area of interest of possible exhaustion / long-entries IF reached.
Key support & broader bullish invalidation rests at 1.2754/89. A topside breach / close above 1.33 is needed to mark resumption targeting the 2017 high-week close at 1.3494 and the key resistance at the upper parallel / 61.8% retracement / 2016 high-week close at 1.3638/75.
For a complete breakdown of Michaels trading strategy, review his Foundations of Technical Analysis series on Building a Trading Strategy
Bottom line: The threat remains for further loses in the British Pound within the confines of ascending formation we‘ve been tracking off the 2018 & 2019 lows. From a trading standpoint, we’ll be on the lookout for possible downside exhaustion on a move towards the lower parallel to offer more favorable long-entries. Ill publish an updated GBP/USD Price Outlook once we get further clarity in near-term price action.
Even the most seasoned traders need a reminder every now and then- Avoid these Mistakes in your trading
GBP/USD Trader Sentiment

A summary of IG Client Sentiment shows traders are net-long GBP/USD - the ratio stands at +1.26 (55.7% of traders are long) – weak bearish reading
Long positions are 0.2% higher than yesterday and 6.9% higher from last week
Short positions are 14.6% lower than yesterday and 26.9% lower from last week
We typically take a contrarian view to crowd sentiment, and the fact traders are net-long suggests GBP/USD prices may continue to fall. Traders are further net-long than yesterday and last week, and the combination of current positioning and recent changes gives us a stronger GBP/USD-bearish contrarian trading bias from a sentiment standpoint
See how shifts in GBP/USD retail positioning are impacting trend- Learn more about sentiment!
---
Relevant UK / US Data Release

Economic Calendar - latest economic developments and upcoming event risk. Learn more about how we Trade the News in our Free Guide!
Previous Weekly Technical Chart
Gold (XAU/USD)
New Zealand Dollar (NZD/USD)
Crude Oil (WTI)
Australian Dollar (AUD/USD)
Euro (EUR/USD)
Japanese Yen (USD/JPY)
Euro vs Japanese Yen (EUR/JPY)
Canadian Dollar (USD/CAD)
免責事項:
このコンテンツの見解は筆者個人的な見解を示すものに過ぎず、当社の投資アドバイスではありません。当サイトは、記事情報の正確性、完全性、適時性を保証するものではなく、情報の使用または関連コンテンツにより生じた、いかなる損失に対しても責任は負いません。
WikiFXブローカー
話題のニュース
MSquareは出金拒否?「ASIC登録=安全」とは限らない危険な罠
 WikiFX
【7/28〜8/1】来週の重要経済指標まとめ|FX・株に影響するイベント一覧
WikiFX今週、日本人ユーザーが最も検索されたFX会社まとめ[7月25日]
WikiFXレート計算

